
Figure 4.
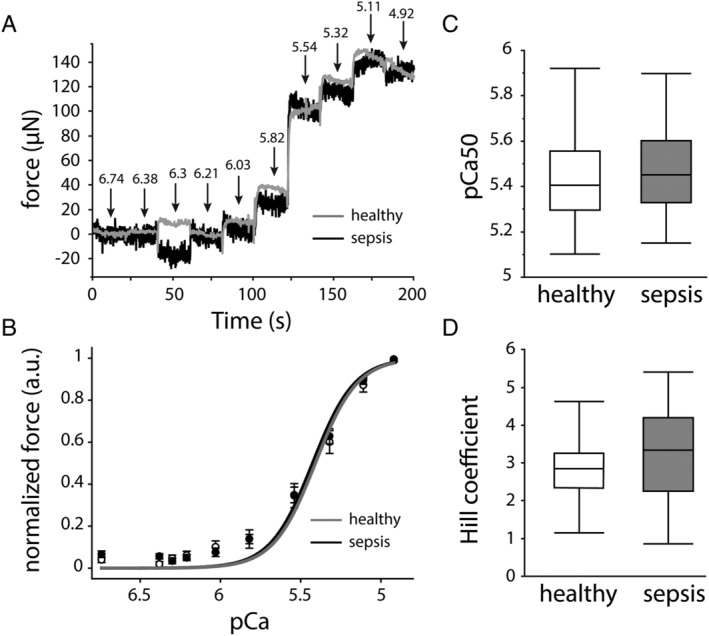
Effect of sepsis on myofibre calcium sensitivity of the contractile apparatus. (A) Representative force traces showing increasing force for each decreasing pCa step. Grey curve = healthy controls, black curve = septic mice. (B) Mean pCa–force group curves with reconstructed Hill fits. Data presented as mean ± standard error of the mean. White circles + grey curve = healthy controls, black circles + black curve = septic mice. (C) Group analyses of pCa50 and (D) Hill coefficients. (healthy n = 23 myofibres from five mice, sepsis n = 45 myofibres from 10 mice) *P ≤ 0.05, **P ≤ 0.01, ***P ≤ 0.001.