Figure 5.

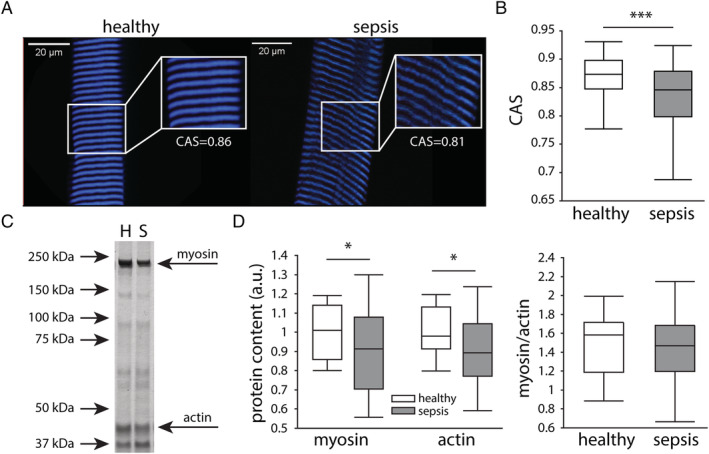
Effect of sepsis on sarcomere organization and muscular myosin/actin content. (A) Sarcomeres were visualized by label‐free multiphoton second harmonic generation (SHG) microscopy. Representative images of SHG measurements in healthy controls and septic mice. Scale bars are 20 μm. (B) Cosine angle sum (CAS) measurements of the SHG signal, indicating the variability in angular myofibrils. (healthy n = 256 from 86 myofibres from six mice, sepsis n = 433 from 145 myofibres from 10 mice) (C) Representative silver staining of myosin and actin in the gastrocnemius muscle. H lane represents a healthy animal, and S a septic one. (D) Muscular myosin and actin protein content as percentage of controls, and myosin‐to‐actin ratio. (healthy n = 15 mice, sepsis n = 30 mice) *P ≤ 0.05, **P ≤ 0.01, ***P ≤ 0.001.
