Figure 2.

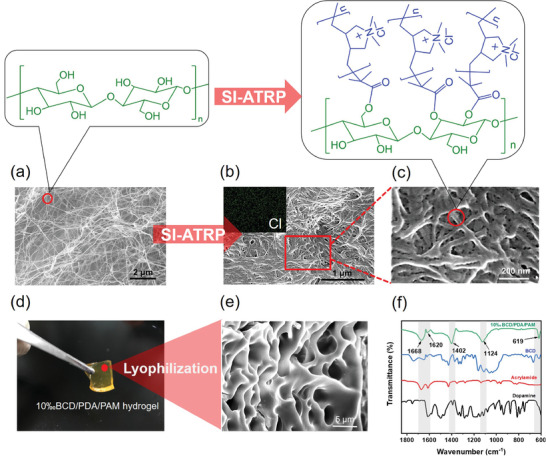
SEM images of a) BC and b,c) BCD; the inset of (b) is the element mapping of Cl. d) Digital photo and e) SEM image of 10‰BCD/PDA/PAM hydrogel. f) FT‐IR spectra of dopamine, acrylamide, BCD and 10‰BCD/PDA/PAM hydrogel.

SEM images of a) BC and b,c) BCD; the inset of (b) is the element mapping of Cl. d) Digital photo and e) SEM image of 10‰BCD/PDA/PAM hydrogel. f) FT‐IR spectra of dopamine, acrylamide, BCD and 10‰BCD/PDA/PAM hydrogel.