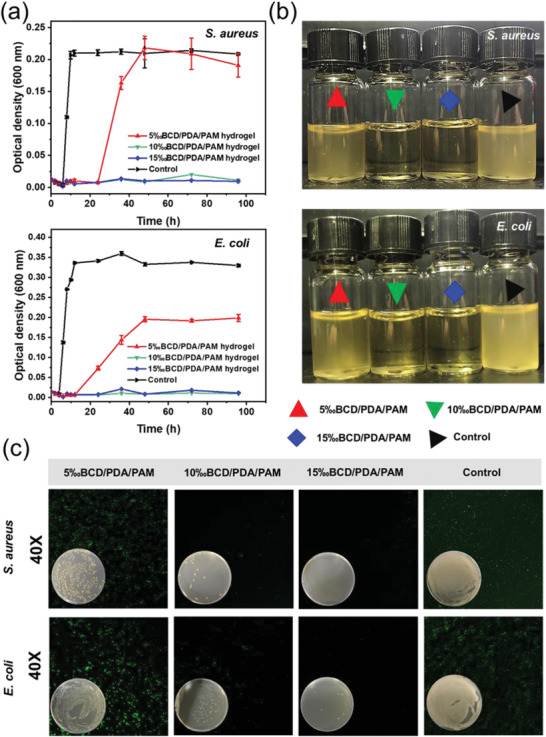
Figure 4.

a) Growth curves of S. aureus and E. coli as a function of culture time in the groups of 5‰BCD/PDA/PAM, 10‰BCD/PDA/PAM, and 15‰BCD/PDA/PAM hydrogels, and the control group (culture solution). The error bars showed standard deviation (n = 3). b) Digital photos of the S. aureus (105 per CFU, 4 mL) and E. coli (105 per CFU, 4 mL) solutions cocultured with the hydrogels after 48 h. c) Live/dead staining of S. aureus and E. coli after cocultured with the hydrogels for 24 h. The inset digital photos showed the bacterial colonies of S. aureus and E. coli on agar plates for 24 h.
