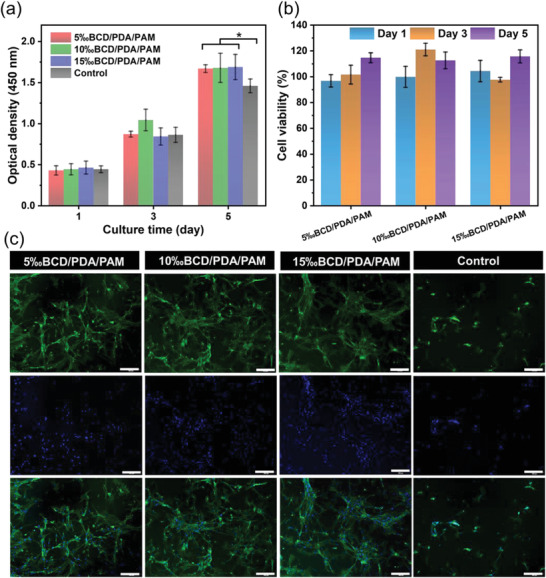
Figure 5.

a) CCK‐8 assays of BMSCs and b) cell viability for BCD/PDA/PAM hydrogels after 1, 3, and 5 days of culture. The error bars showed standard deviation (n = 3), *p < 0.05 (one‐way ANOVA followed by Bonferroni's multiple comparison test). c) Fluorescence microscope of BMSCs on the groups of BCD/PDA/PAM hydrogels and the control group (culture solution) after 3 days of culture. Scale bar: 200 µm.
