Figure 2.

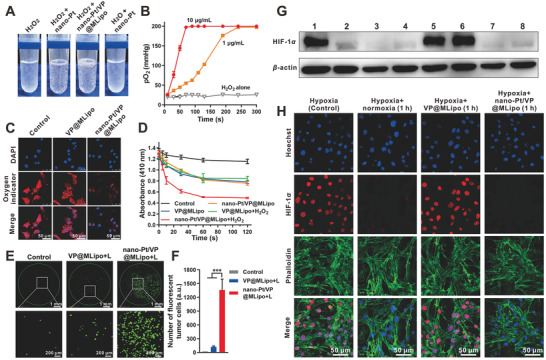
Nano‐Pt/VP@MLipo catalyzed H2O2 decomposition for O2 production, alleviated hypoxia and HIF‐1α expression in 4T1 cells and elevated the reactive oxygen species (ROS, 1O2) levels upon light (690 nm) irradiation. A) H2O2 (100 × 10−6 m) was decomposed by nano‐Pt catalyzation. The generated O2 bubbles were seen adsorbed on the inside of the tube wall. Pure water containing free nano‐Pt was set as a negative control. B) Partial oxygen pressure (pO2) with time after adding nano‐Pt/VP@MLipo (1 or 10 µg mL−1 Pt) into H2O2 solution. C) Nano‐Pt increased the intracellular oxygenation as examined using the oxygen indicator [Ru(dpp)3]Cl2. The red fluorescence of the dye was quenched in the presence of oxygen. D) 1O2 production determined using DPBF assay. DPBF was oxidized by 1O2, and led to a decreased absorbance at 410 nm. E) Intracellular ROS production upon light (690 nm) irradiation detected using the probe DCFH‐DA. The fluorescent 4T1 cells in the 96‐well plate were monitored and photographed using IncuCyte live cell analysis system. F) The number of fluorescent cells in panel (E) were quantified. G) Western blot of HIF‐1α expression in 4T1 cells after various treatments. 1) Hypoxia (Control); 2) Normoxia; 3) Hypoxia + normoxia (1 h); 4) Hypoxia + normoxia (4 h); 5) Hypoxia + VP@MLipo (1 h); 6) Hypoxia + VP@MLipo (4 h); 7) Hypoxia + nano‐Pt/VP@MLipo (1 h); 8) Hypoxia + nano‐Pt/VP@MLipo (4 h). H) CLSM observation of HIF‐1α expression and its nuclear translocation in 4T1 cells. The F‐actin was labeled with FITC‐labeled phalloidin to outline the cells. Data are presented as mean ± s.d. (n = 3). ***p < 0.001.
