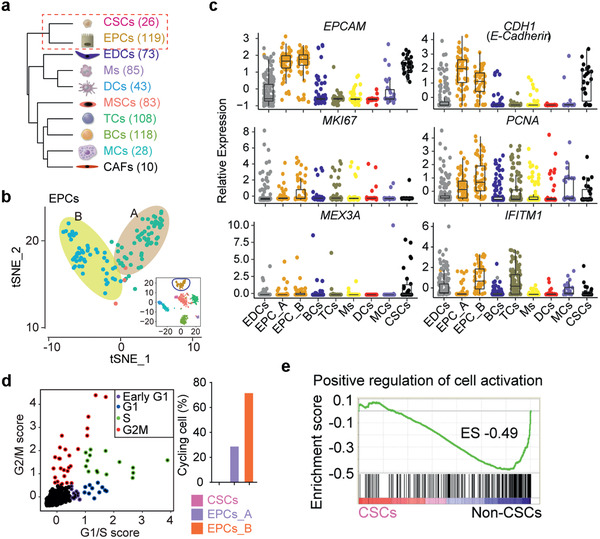
Figure 2.

Similarities and differences among CSCs, EPCs_A and EPCs_B. a) Unsupervised hierarchical clustering of the 10 clusters based on the average gene expression of single cells in each subpopulation. Each node represents a subpopulation. Number of cells analyzed for each subpopulation are shown on the right side. b) t‐SNE plot showing distinct subpopulations of EPCs. EPCs could be distributed into two subpopulations under high resolution (t‐SNE resolution = 0.8) by Seurat, termed EPCs_A and EPCs_B. c) Expression of epithelial lineage marker genes (EPCAM, CDH1 also known as E‐CADHERIN) and cell proliferation markers (MKI67 and PCNA) in each cell. CSCs and EPCs exhibit similar expression patterns. d) Classification of single cells into cell‐cycle phase based on expression patterns of selected cell‐cycle specific genes.[ 9 ] Color represents a cycling cell; black represents noncycling. Right panel indicates distribution of cycling cells in EPCs and CSCs. e) GSEA analysis of signature in GO term of “positive regulation of cell activation” in CSCs compared with non‐CSCs. Enrichment score (ES) was calculated by GSEA software from the Broad Institute. Black bars represent individual genes in rank order.
