Figure 3.

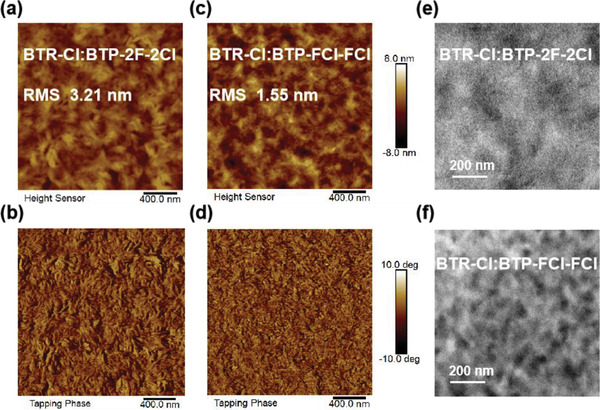
a–c) AFM height images (2 × 2 µm), b–d) AFM phase images (2 × 2 µm), and e–h) TEM images (scale bar 200 nm) of BTR‐Cl:BTP‐2F‐2Cl, BTR‐Cl:BTP‐FCl‐FCl blend films.

a–c) AFM height images (2 × 2 µm), b–d) AFM phase images (2 × 2 µm), and e–h) TEM images (scale bar 200 nm) of BTR‐Cl:BTP‐2F‐2Cl, BTR‐Cl:BTP‐FCl‐FCl blend films.