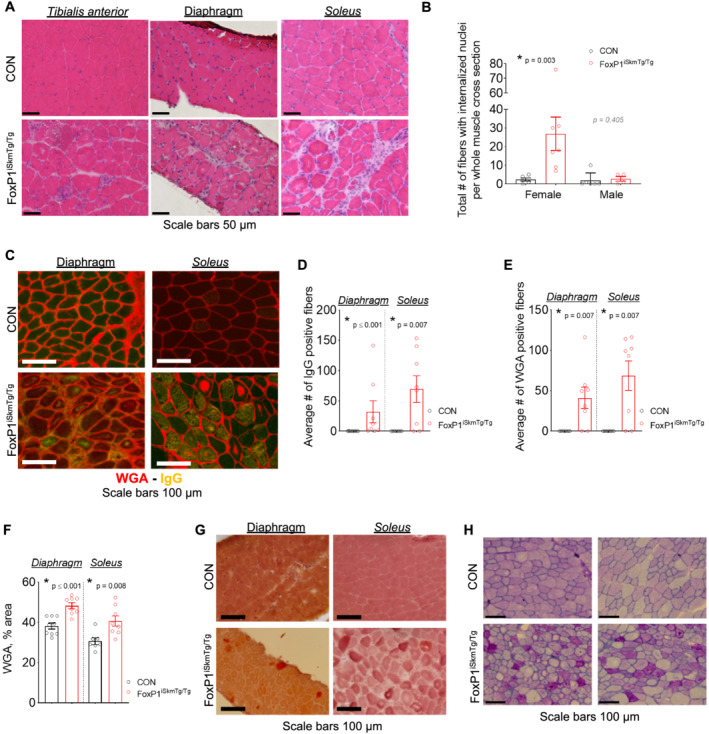
Figure 3.

Skeletal muscles of FoxP1iSkmTg/Tg exhibit myopathy. (A) Representative images of haematoxylin and eosin (H&E) stained cross‐sections show increased extracellular space, presence of mononucleated cells, and increased number of myofibres with centralized nuclei in muscles from CRE+ FoxP1iSkmTg/Tg mice compared with CRE‐ littermate controls (CON). (B) Quantification of total number of fibres presenting internalized nuclei in soleus muscle cross‐sections from CRE+ FoxP1iSkmTg/Tg mice and CRE‐ littermate controls. (C) Representative muscle cross‐sections from female CRE+ FoxP1iSkmTg/Tg mice and CRE‐ littermate controls stained with mouse immunoglobulin G (IgG) antibodies and wheat germ agglutinin (WGA). (D–F) muscles from female CRE+ FoxP1iSkmTg/Tg mice show increased presence of intra‐myofibre endogenous IgG (D) and WGA (E) indicative of muscle damage, and increased percent area positive for WGA (F) compared to CRE‐ littermate controls. Data are reported as mean ± SEM. (G) Skeletal muscle cross‐sections from female CRE+ FoxP1iSkmTg/Tg mice stained with Alizarin Red S show dysregulation of intracellular Ca2+ compared with CRE‐ littermate controls. (H) Representative images of tibialis anterior cross‐sections stained with periodic acid‐Schiff (PAS) reveal the accumulation of PAS + vacuoles in muscles of CRE+ FoxP1iSkmTg/Tg mice compared with CRE‐ littermate controls (CON). Depending on data distribution, unpaired two‐tailed t‐tests or Mann–Whitney tests were performed to test for statistical differences between groups. Data are reported as mean ± SEM. Note that data from male CRE+ FoxP1iSkmTg/Tg mice and CRE‐ littermate controls are presented in Figure S6 .
