Figure 9.

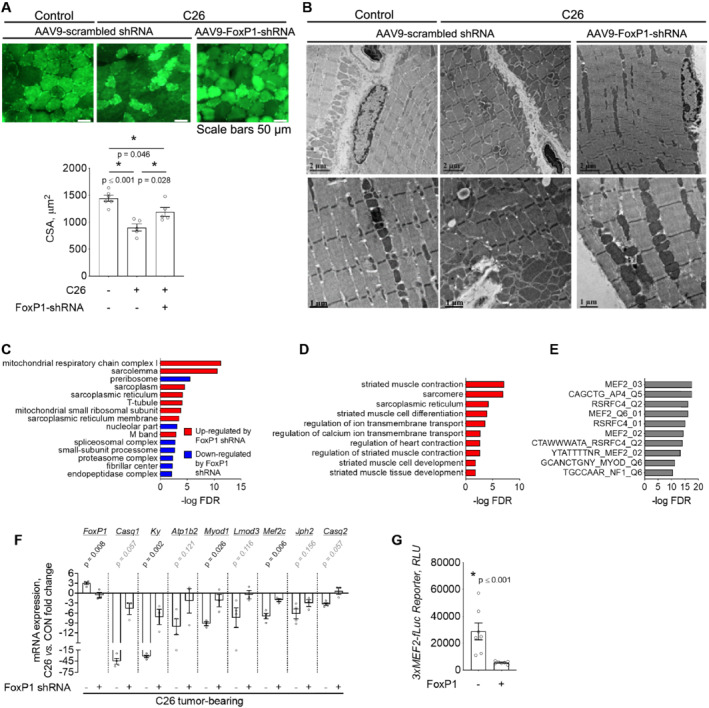
FoxP1 mediates cancer‐induced muscle atrophy and the repression of MEF2 target genes. (A) Transduction of tibialis anterior muscles of C26‐tumour bearing mice with an AAV9 vector encoding FoxP1‐shRNA blunts the C26‐induced reduction in muscle fibre cross‐sectional area (CSA) that is observed in muscles transduced with AAV9 encoding scrambled‐shRNA. (B) Representative transmission electron microscopy images of tibialis anterior muscles from sham and C26‐tumour bearing mice transduced with the AAV9 encoding FoxP1 shRNA or scrambled shRNA, showing ultrastructural alterations in response to C26 tumour burden, that are improved in response to FoxP1 knockdown. (C) Microarray analyses conducted on pooled samples (n = 3 per group) and further analysed with string to identify enriched cellular components, indicate that FoxP1 knockdown attenuates the tumour‐induced repression of genes involved in muscle structure/function (blue categories) and reduces the activation of genes involved in protein breakdown (red categories). (D–E) Genes repressed by two‐fold or more in response to C26 tumour burden that were rescued by two‐fold or more in muscles expressing FoxP1‐shRNA (249 genes) were further analysed using DAVID to identify enriched non‐redundant functional annotations (D), and using gene set enrichment analysis (GSEA) and the molecular signatures database to identify enriched transcription factor binding motifs among gene promoters (E). FoxP1 targets repressed in muscle of C26 mice were enriched for MEF2 and MYOD target genes involved in muscle contraction and muscle cell differentiation. (F) RT‐qPCR validation demonstrating that FoxP1 knockdown rescues the C26‐induced repression of several MEF2 target genes involved in muscle structural development, function, and maintenance. (G) Mouse tibialis anterior muscles were transfected with a FoxP1 expression plasmid or empty vector, plus a MEF2‐dependent luciferase reporter to assess MEF2 activity. RLU = relative light unit. Statistical differences were determined by conducting a one‐way ANOVA in panel (A), unpaired two‐tailed t‐test or Mann–Whitney tests depending on data distribution in panel (F) and Wilcoxon test in panel (G). Data are reported as mean ± SEM.
