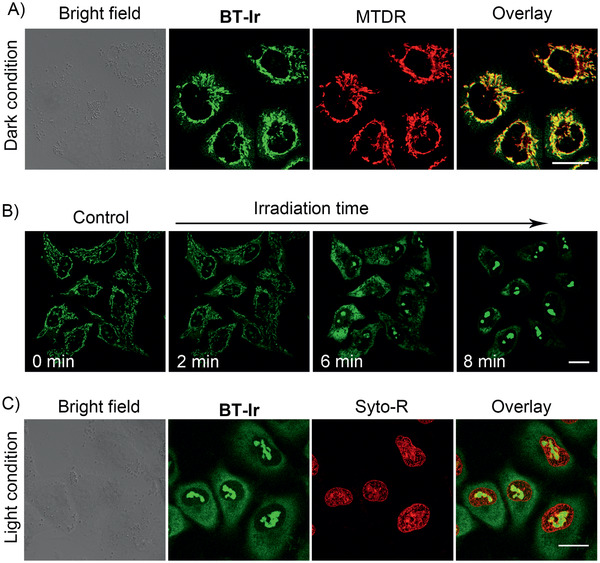
Figure 3.

A) Confocal images of A549 cells co‐stained with BT‐Ir and MTDR under a dark condition. B) Confocal images of A549 cells stained with BT‐Ir before (control) and after light irradiation. A549 cells were irradiated at 405 nm (15 mW cm–2), irradiated 5 s every 2 min for a total of 10 cycles (Video S1, Supporting Information). C) Confocal imaging of A549 cells co‐stained with BT‐Ir and Syto‐R under 405 nm light irradiation condition. For BT‐Ir, λ ex: 405 nm, λ em: 620 ± 20 nm (pseudo green‐color); For MTDR, λ ex: 633 nm; λ em: 650 ± 10 nm. For Syto‐R, λ ex: 633 nm, λ em: 650 ± 10 nm. Scale bar: 20 µm.
