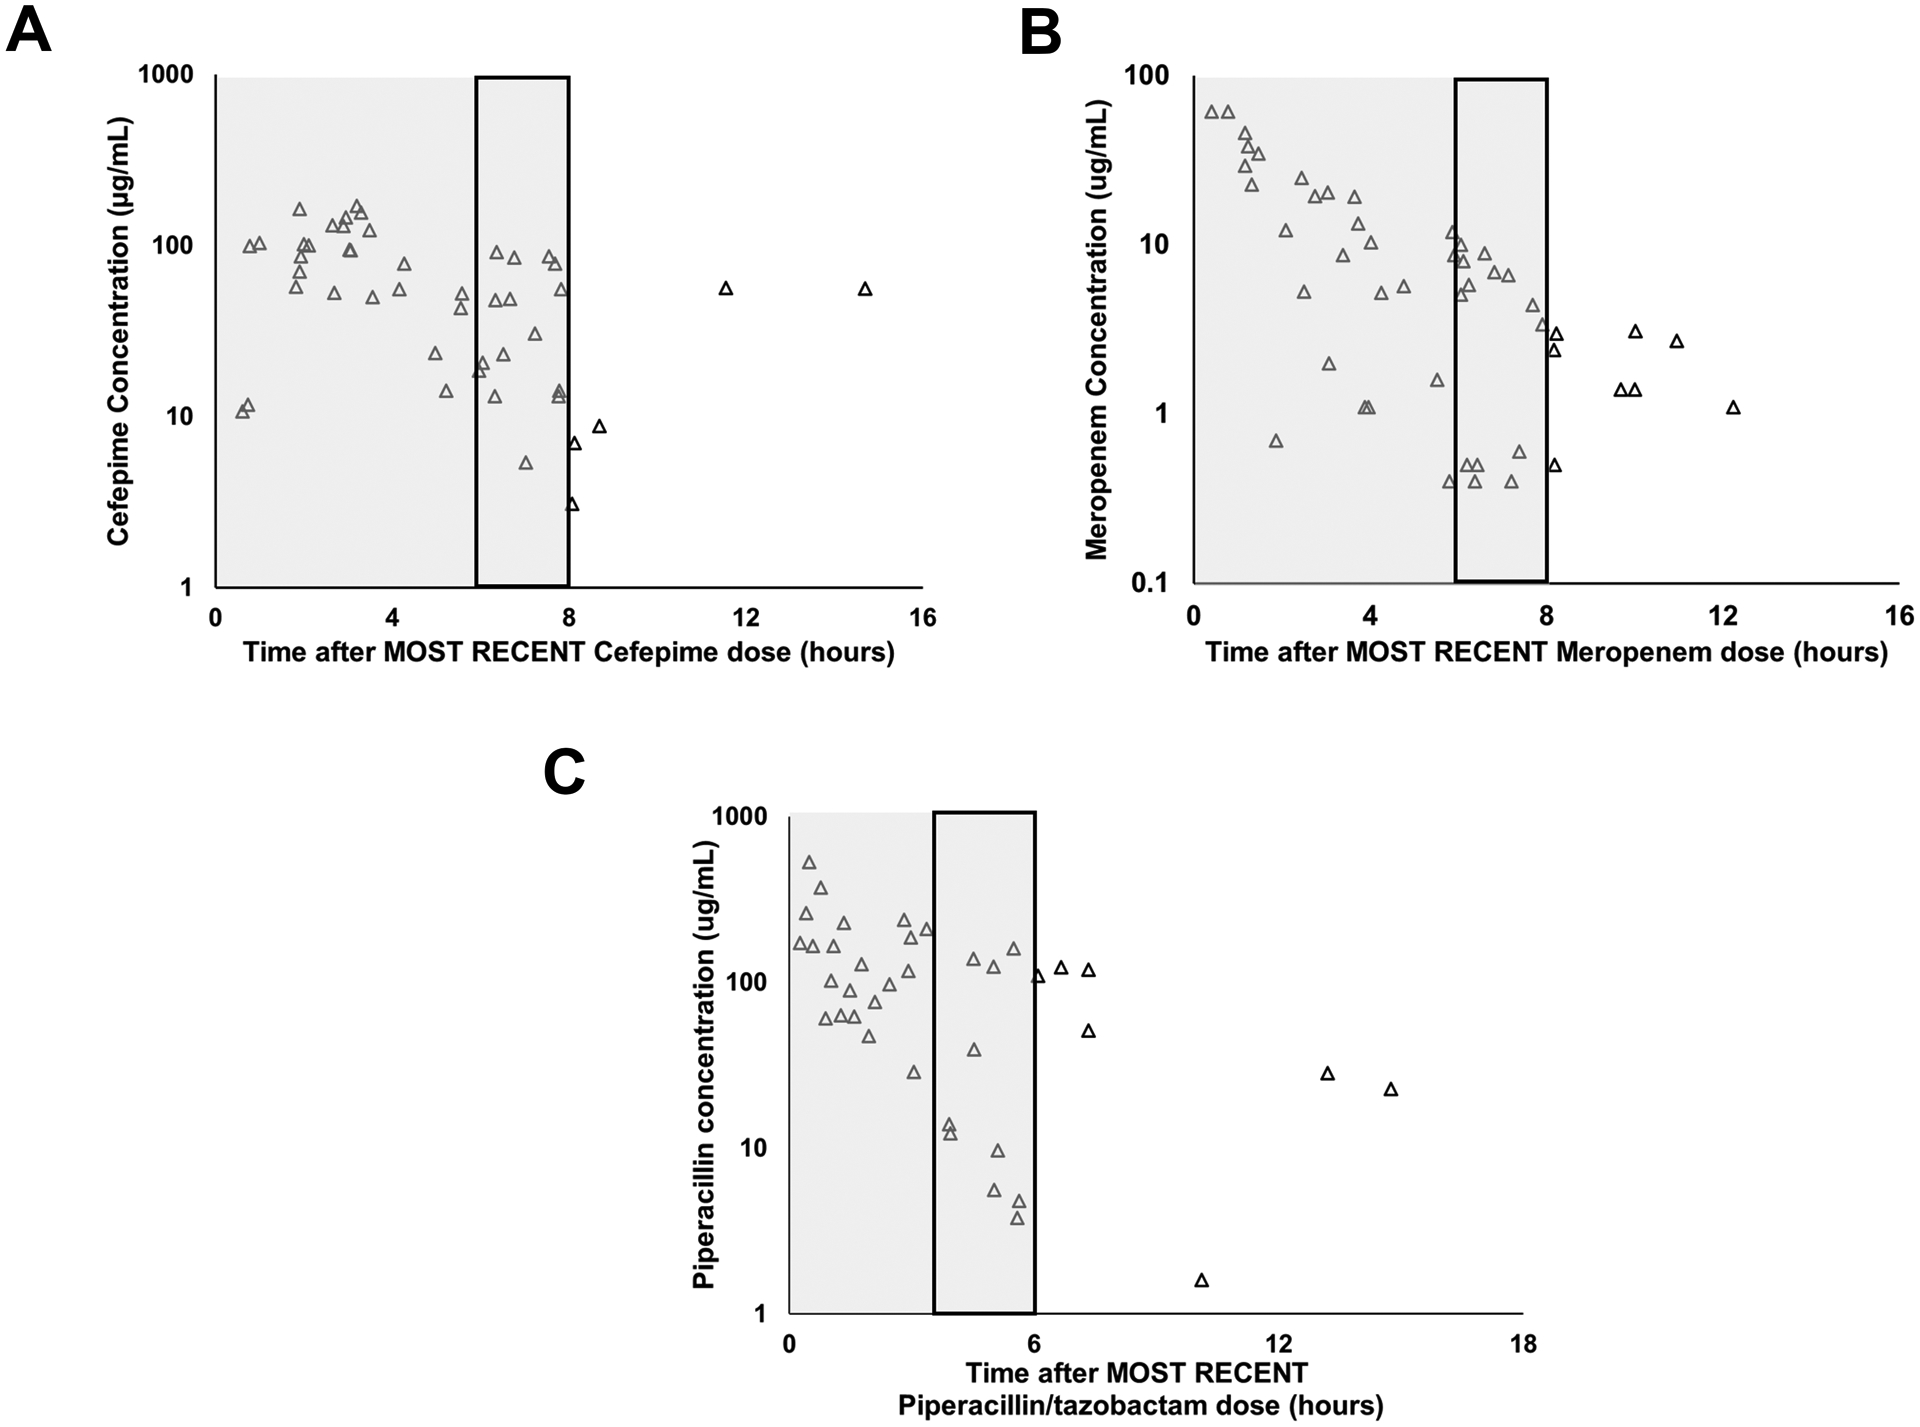
Figure 1: Free Cefepime (A), Meropenem (B) and Piperacillin (C) concentrations obtained from residual blood from clinical samples.

Free drug concentrations were plotted according to time after the most recent dose of β-lactam antibiotic (X-axis). Y- axis represents concentration (μg/mL). Samples obtained from patients who were prescribed cefepime, meropenem and piperacillin/tazobactam showed spread over the entire dosing interval (typically every 6 hours for piperacillin/tazobactam, 8 hours for cefepime and meropenem) and were not clustered around one time point. Shaded areas represent the typical dosing interval. There was high variability in the free concentrations of the antibiotics, particularly towards the end of dosing intervals. Rectangular boxes outlined in black represent the last two hours of the most commonly used dosing interval.
