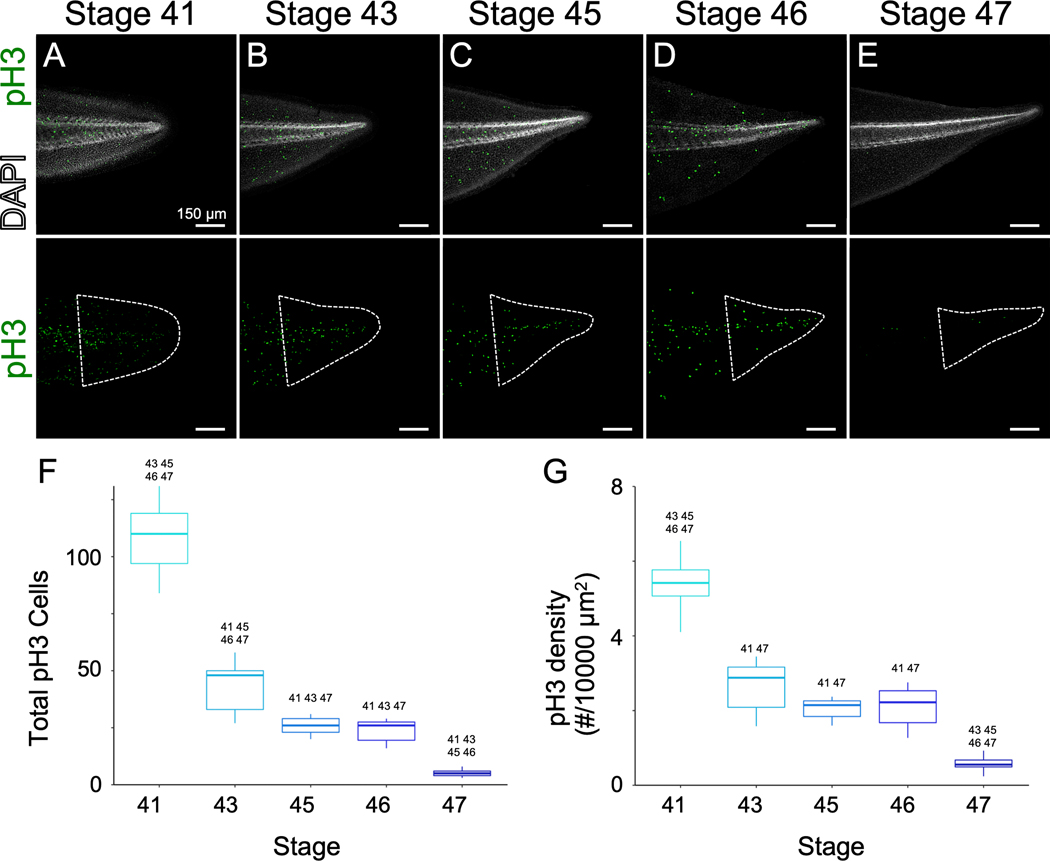
Figure 2. Proliferation in the posterior of the tail declines over development.
A-E) Immunohistochemistry for pH3 in uninjured tails at stage 41 (A), 43 (B), 45 (C), 46 (D), 47 (E) counterstained with DAPI. Scale bar is 150 µm. F,G) Box-and-whisker plots showing total numbers of pH3 positive cells (F) or density of pH3 positive cells per 10,000 µm2 (G). For (F,G), the midline represents the median of all tadpoles assayed, box size represents the interquartile range, and the lines represent the range. Outliers are indicated as points. n ranges 7 – 9 per group. Stage numbers above a condition indicated statistical significance (p<0.05) between the given group and those stages as determined by ANOVA (p<2×10⁻¹⁶ for F) and G) followed by Tukey’s post-test. Area of quantification is indicated by dashed white outline.

