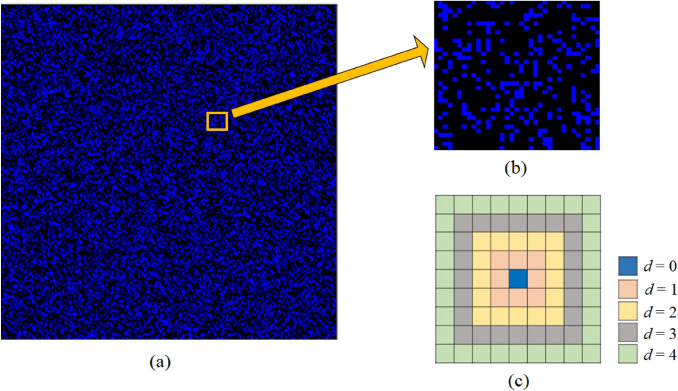
Fig. 2.
Simulation landscape and interaction neighbourhood: a A zone of interest with cells. Density of small blue boxes represent population density. b A small sub-zone, denoting the distribution of susceptible and empty cells. c Interaction conventions: staying home, ; sphere of influence includes only first nearest neighbours denoted by ; sphere of influence includes first as well as next nearest neighbours denoted by , and so on

