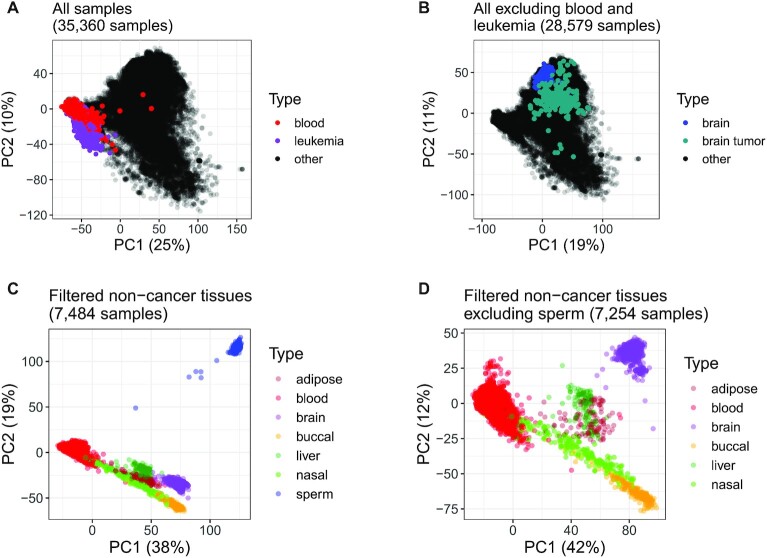
Figure 3.
Scatter plots of top two components from PCAs of autosomal DNAm (‘Materials and Methods’ section). Each axis label also contains percent of total variance explained by the component. (A) PCA of 35 360 samples, with color labels for non-cancer blood (N = 6001 samples, red points) and leukemias (780, purple) and remaining samples (28 579, black). (B) PCA of 28 579 samples remaining after exclusion of blood and leukemias from (A), highlighting non-cancer brain (N = 602 samples, blue), brain tumors (221, dark cyan) and remaining samples (27 756, black points). Facet plots of sample subsets in (A) and (B) are shown in Supplementary Figure S6. (C) and (D) display samples from seven non-cancer tissues for which at least 100 samples were available from at least two studies (‘Materials and Methods’ section). (C) PCA of 7484 samples from all seven tissue types, including sperm (N = 230 samples, blue), adipose (104, dark red), blood (6,001, red), brain (602, purple), buccal (244, orange), nasal (191, light green) and liver (112, dark green). (D) PCA of 7254 non-cancer tissue samples remaining from (C) after exclusion of sperm, with color labels as in (C).

