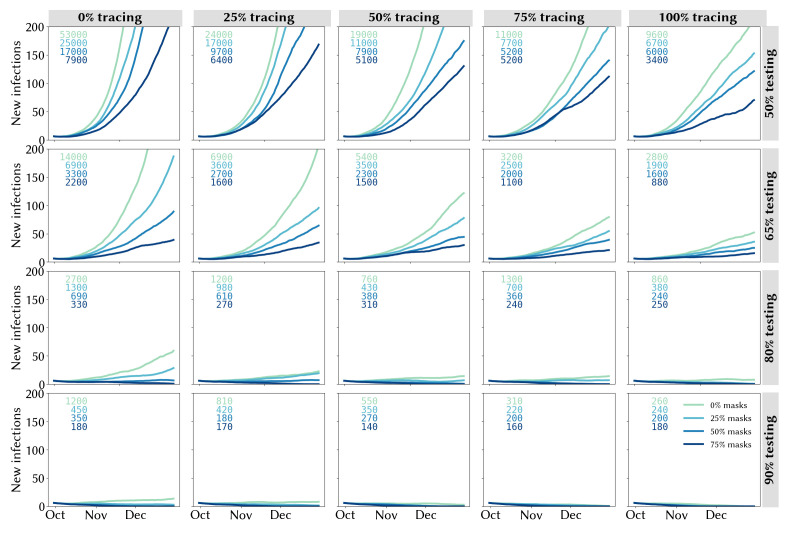
Figure 3.
Trailing 14-day average of daily locally acquired infections under different assumptions about the testing rate (rows), proportion of community contacts that can be traced within 1 week (columns) and mask uptake (line colours). Projections represent the median of 100 simulations. Text boxes in each panel display the cumulative number of infections during 1 October to 31 December 2020.

