
Figure 3.
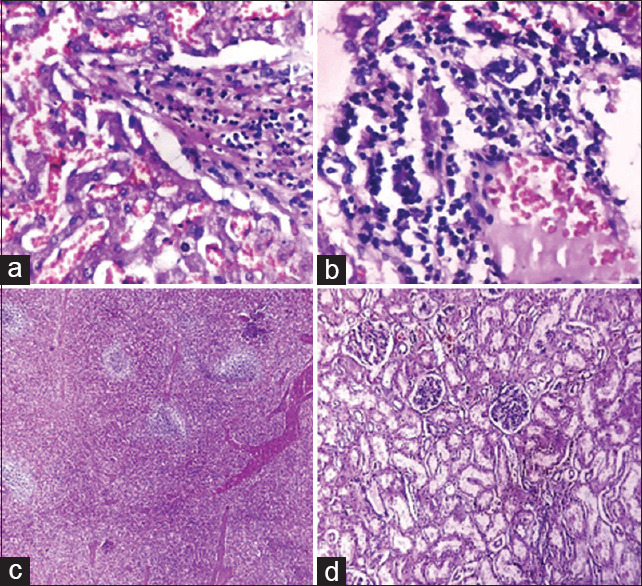
(a) Liver: Congestion of sinusoids (H and E, ×400). (b) Liver: lymphocytic infiltrate in portal tract (H and E, ×400). (c) Spleen: Congestion and white pulp depletion. (H and E, ×40. (d) Kidney: Congestion and autolytic changes (H and E, ×100)