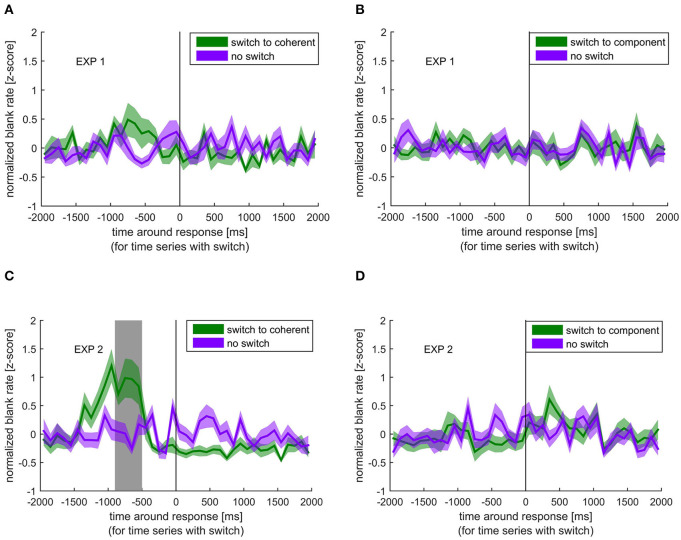
Figure 3.
Normalized blank rate around the response indicating a perceptual switch (green) compared with the normalized blank rate during no switch (purple). Colored lines and ribbons represent mean ± standard error of the mean (SEM). Vertical shaded area marks significant time points revealed by the non-parametrical statistical test procedure described by Maris and Oostenveld (2007). (A) Switch to coherent motion in experiment 1. (B) Switch to component motion in experiment 1. (C) Switch to coherent motion in experiment 2. (D) Switch to component motion in experiment 2.

