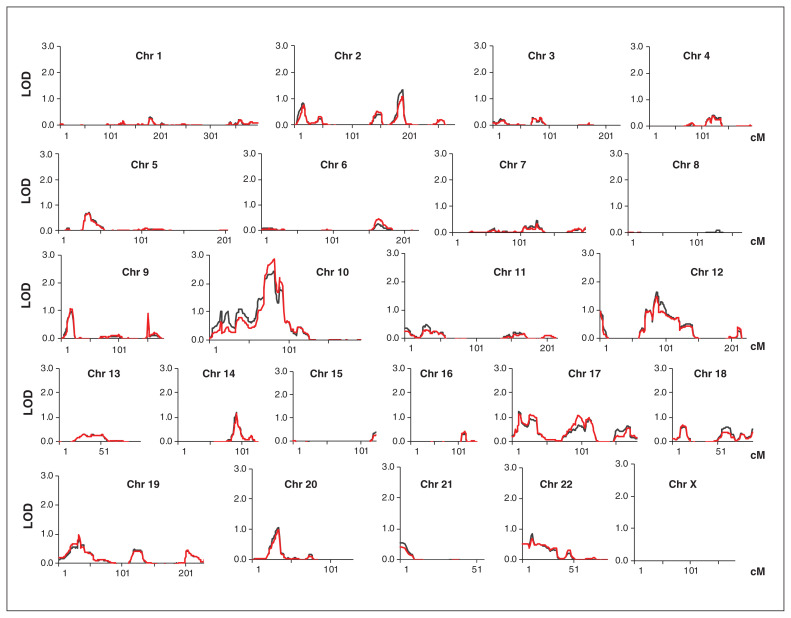
Fig. 1.
Results of the genome-wide linkage analysis in 15 extended families with bipolar disorder. The results are shown for nonparametric linkage under linear (black line) and exponential (red line) models. Each chromosome is represented in a plot, including the X chromosome. A linkage signal with LOD greater than 2 was observed at chromosome 10q11.23-q21, with a maximum linear LOD score of 2.424 at marker rs10761725 (uncorrected p = 0.00042) and a maximum exponential LOD score of 2.863 (uncorrected p = 0.00014). Additional markers were subsequently added to refine the 10q11.23-q21 locus. Chr = chromosome; LOD = logarithm of the odds (for linkage).

