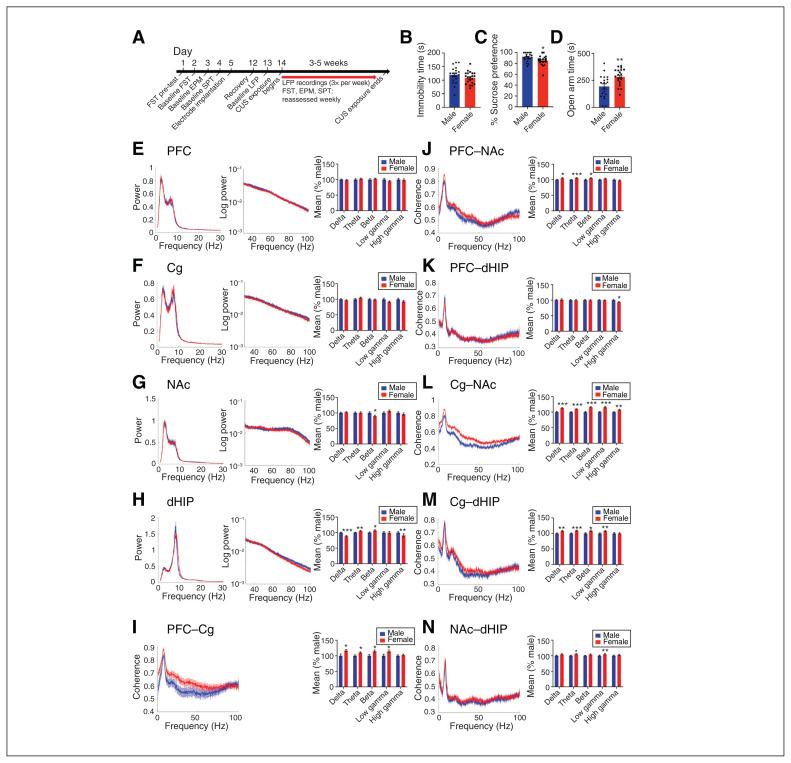
Fig. 1.
Baseline sex differences in depression-like behaviours and oscillatory activity in rats. (A) The full experimental timeline is shown. (B–D) No sex differences in time spent immobile in the FST at baseline were evident; however, females showed a lower percent sucrose preference in the SPT and spent more time in the open arms of the EPM. (E–H) Power spectra (left and centre panels) and quantification of power spectra (right panel) at each frequency are shown. We observed no sex differences in mean power spectra in the PFC or the Cg. In the NAc, female rats had lower beta power, than males. In the dHIP, female rats innately had lower delta and high gamma power than male rats, as well as greater theta and beta power. (I–N) Coherence spectra (left panel) and quantification (right panel) at each frequency. Baseline coherence in the PFC–Cg of females was greater in the delta, theta, beta and low gamma frequency bands compared to males. In the PFC–NAc, coherence in the delta, theta and beta frequency bands was higher in female rats than in male rats. In the PFC–dHIP, males innately had greater high gamma coherence. Baseline coherence of all frequency bands in the Cg–NAc were higher in females than males. In the Cg–dHIP, coherence was greater in females in all frequency bands except high gamma. Baseline theta frequency coherence was higher in females in the NAc–dHIP. Power and coherence spectra are presented as normalized data, with jackknife estimates of SEM shown as shaded areas. Quantified power spectra and coherence are presented as percent difference from males ± SEM. A Student t test was used for all analyses. *p < 0.05, **p < 0.01, ***p < 0.001, compared with males. n = 17 males and n = 19 females, 2 electrodes per region per rat. Cg = cingulate cortex; CUS = chronic unpredictable stress; dHIP = dorsal hippocampus; EPM = elevated plus maze; FST = forced swim test; LFP = local field potential; NAc = nucleus accumbens; PFC = prefrontal cortex; SEM = standard error of the mean; SPT = sucrose preference test.

