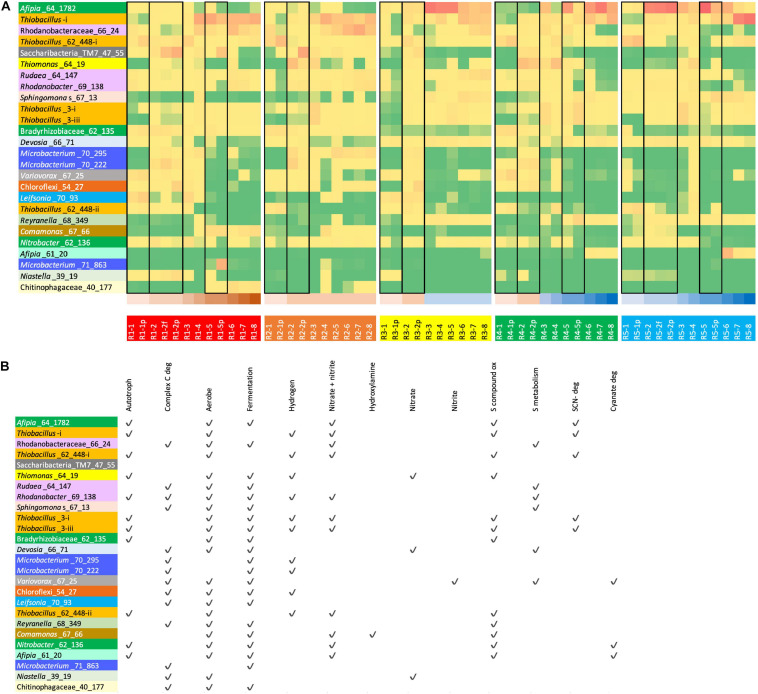
FIGURE 2.
(A) read mapping-based relative abundance of (high red, low yellow to green; see Supplementary Table 4) of the 26 most abundant organisms (rows) in R1 (molasses SCN ramp reactor, shown in shades of brown at the bottom of the table) and/or R5 (SCN ramp reactor without molasses, i.e., “water” reactor, shown in shades of blue at the bottom of the table) across all reactors. Genomes are colored by taxonomic grouping. For the full names of bacteria see (B) Black boxes group together samples from the same time point (biofilm and p = planktonic and f = floc sample). (B) Overview of functionalities encoded in the 26 genotypes representing the most abundant organisms in R1 and/or R5.

