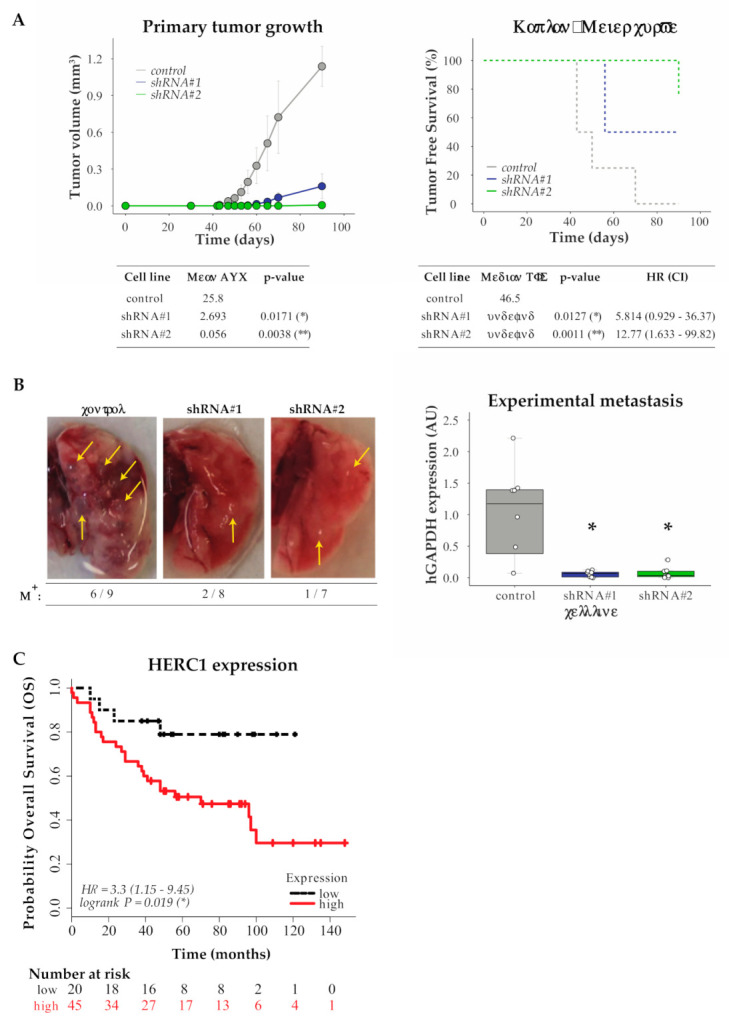
Figure 4.

In vivo and in silico analysis of HERC1 relevance in tumor biology and patients’ survival. (A) Downregulation of HERC1 attenuates tumorigenicity in vivo. Control or HERC1-silenced MDA-MB-231 cells were subcutaneously inoculated into the mammary fat pads of female NOD/SCID mice and tumor growth was monitored every 2–3 days: (Top Left) tumor volume was calculated at the indicated time points (results show mean value ± s.e.m.); (Bottom Left) Area Under Curve (AUC) was performed to analyze differences between treatments (n ≥ 4, Kruskal–Wallis, Dunn’s multiple comparison test; shRNA #1 p = 0.0171 (*) and shRNA #2 p = 0.0038 (**)); (Top Right) Kaplan–Meier curves for Tumor Free Survival (TFS) in mice injected with control or HERC1-silenced cells; and (Bottom Right) log-rank test (Mantel–Cox) analysis (HR, hazard ratio; CI, confidence interval) (n ≥ 4, log-rank (Mantel–Cox) test; shRNA #1 p = 0.0127 (*) and shRNA #2 p = 0.0011 (**)). (B) Silencing effects of HERC1 on experimental metastasis assays: NOD/SCID male mice were inoculated with MDA-MB-231 control or HERC1-silenced cells through tail vein injection and lungs were harvested after two months: (Left) Representative images of lungs at endpoint; metastatic foci are indicated with arrows. M+, ratio of lungs positive for metastatic growth versus the number of injected mice. (Right) Metastatic potential was estimated by qPCR human DNA quantification, normalized to mouse DNA (n = 8, Kruskal–Wallis, Dunn’s multiple comparison test; shRNA #1 p = 0.0187 (*) and shRNA #2 p = 0.0136 (*)). (C) Kaplan–Meier curves for breast carcinoma patients’ Overall Survival (OS) according to HERC1 protein expression status in primary tumors: red solid line and black dashed line indicate cases with high and low expression of HERC1, respectively (n =65, Log-Rank (Mantel–Cox) test, p = 0.019 (*)).
