Figure 2.

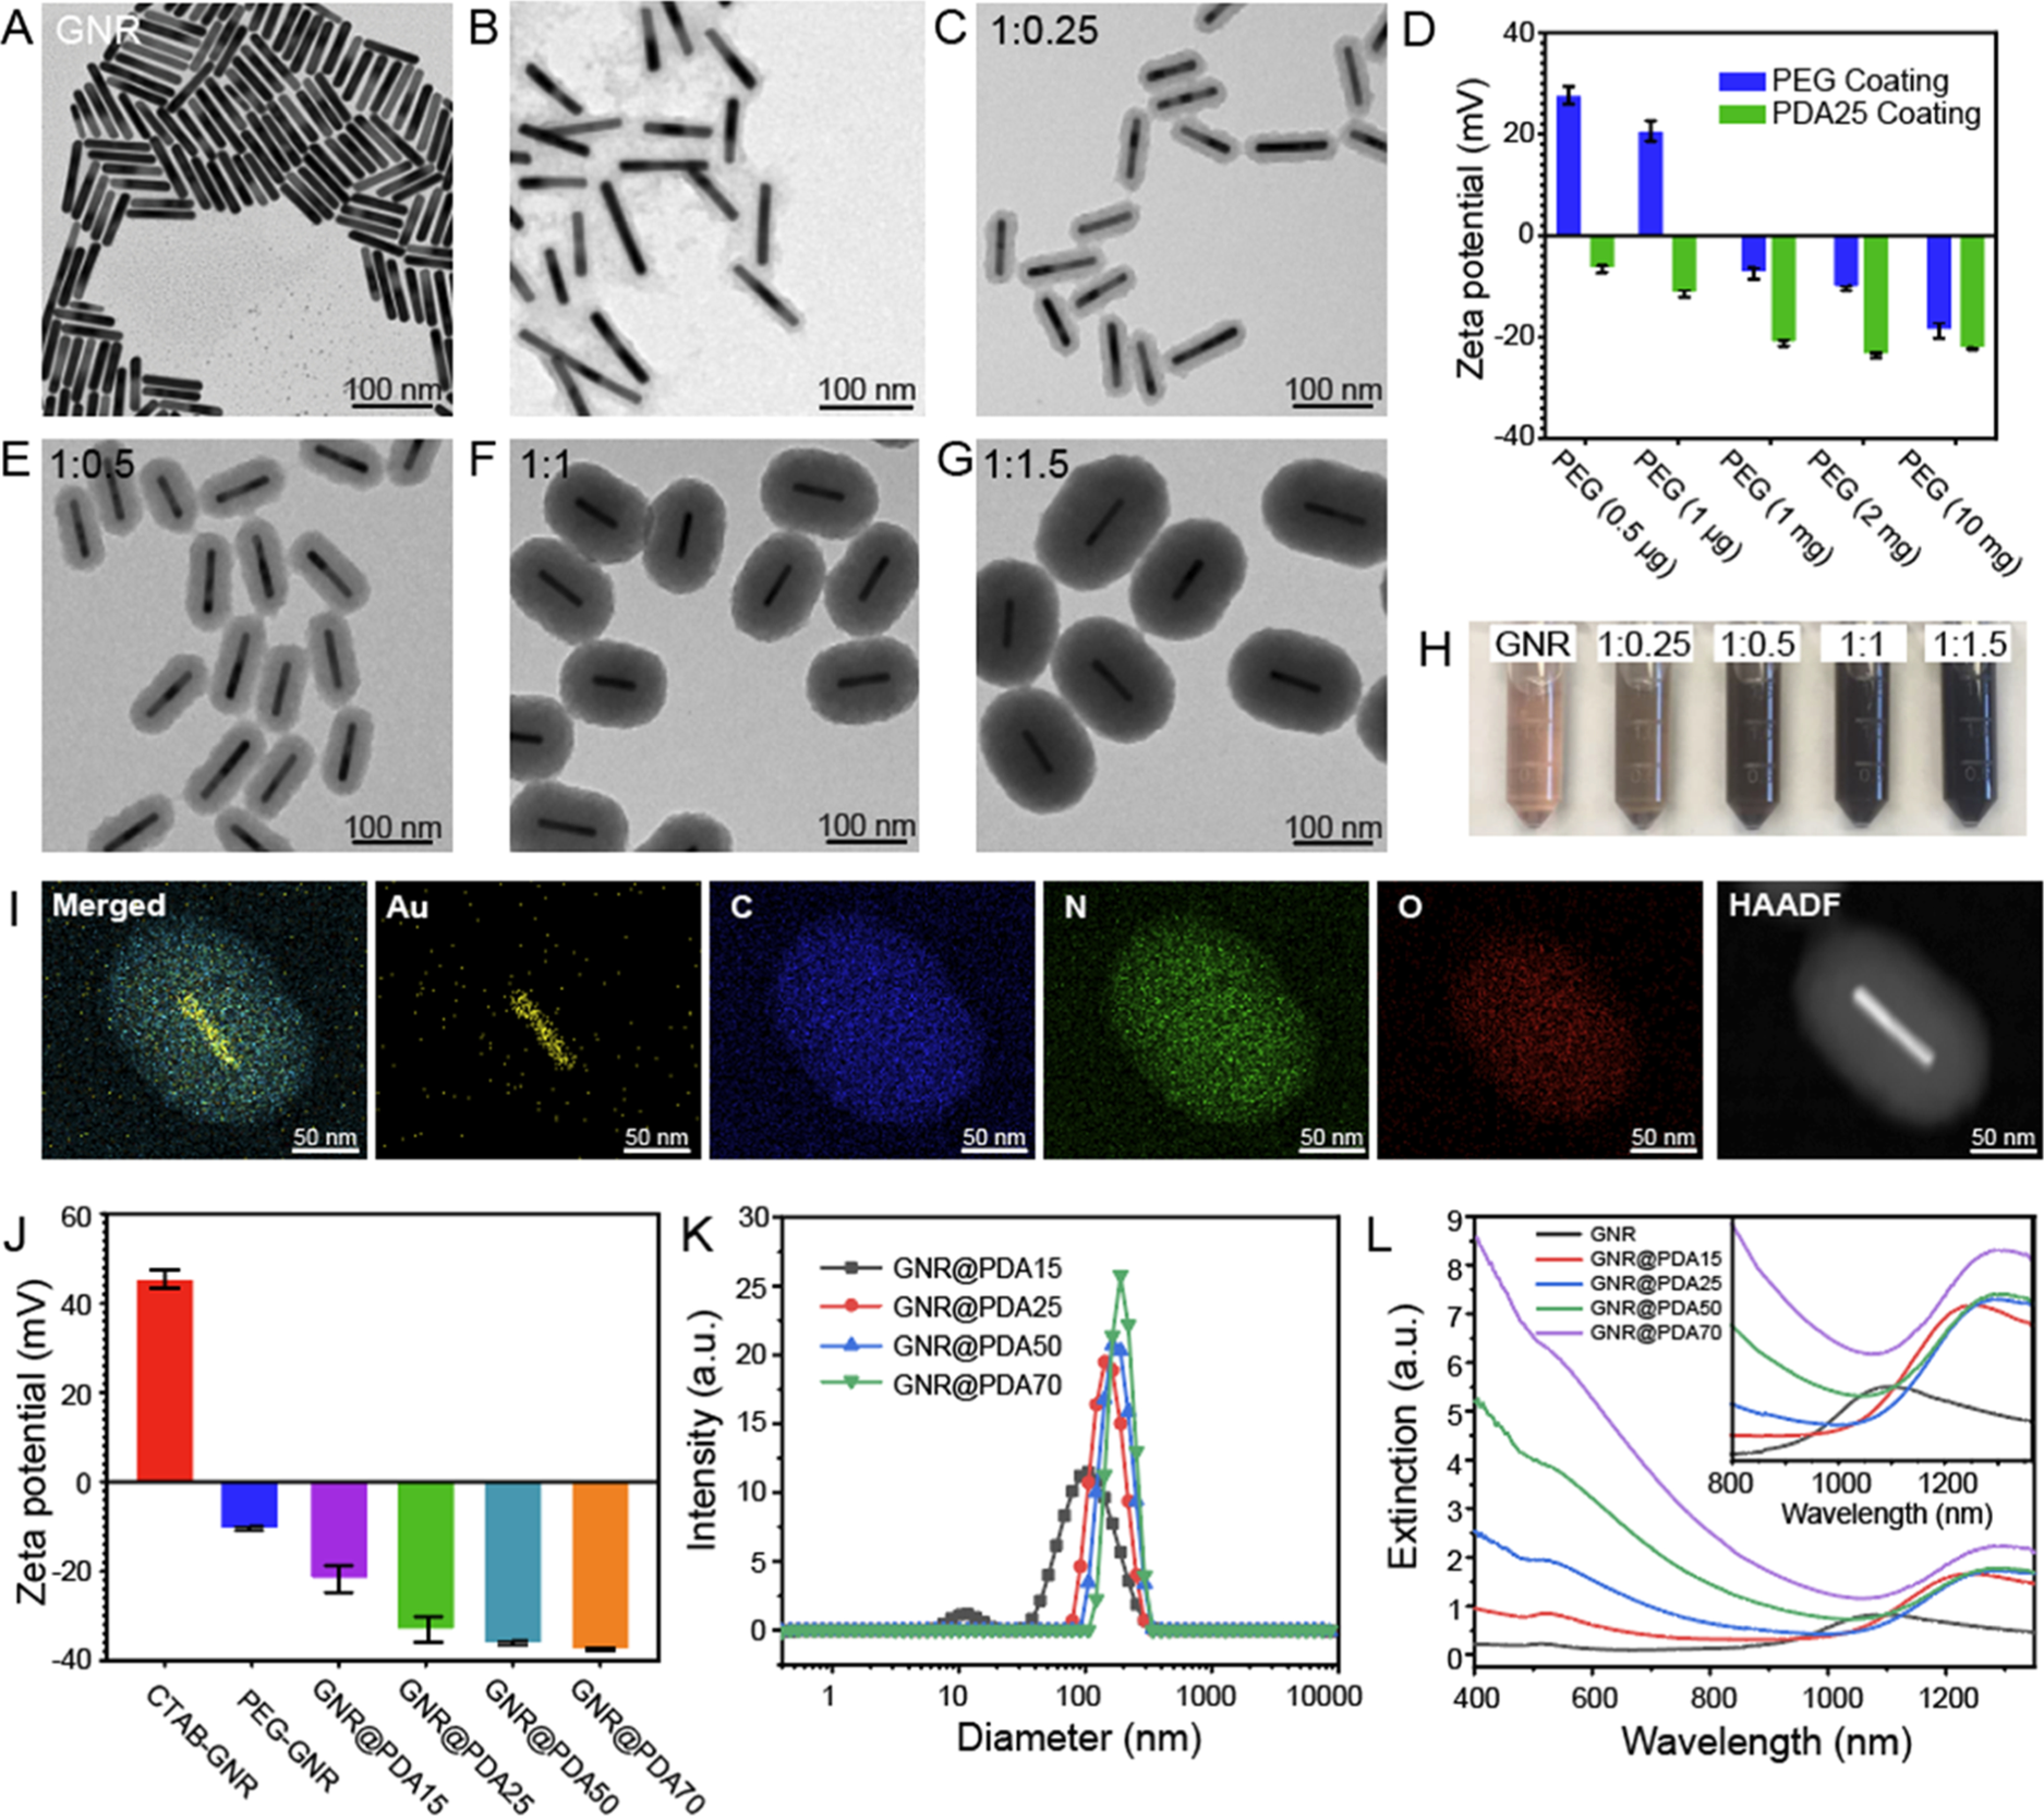
Controllable size of GNR@PDA. (A) TEM images of GNRs. (B,C) TEM images of PDA-coated GNRs where PEG chains had (B) mushroom and (C) brush conformations. (D) ζ potential of PEGylated GNRs before and after PDA coating (PDA thickness = 25 nm). We used different amounts of HS-mPEG (10 mg, 2 mg, 1 mg, 1 μg, and 0.5 μg) for ligand exchange of the GNRs to make either mushroom or brush conformations of PEG chains. (C,E–F) TEM images with different PDA thicknesses: (C) 15, (E) 25, (F) 50, and (G) 70 nm. The mass concentration of GNR was fixed at 0.2 μg/mL, and 1:0.25, 1:0.5, 1:1, and 1:1.5 indicate the mass ratio of GNR to dopamine concentrations. (H) Color of GNR and GNR@PDA solutions. (I) EDX and high-angle annular dark-field images of GNR@PDA. The EDX result shows the core–shell nanostructure of GNR@PDA. GNR@PDA includes gold (Au), carbon (C), nitrogen (N), and oxygen (O). (J) ζ potential of GNR and GNR@PDAs. (K) DLS measurements of GNR@PDA15, GNR@PDA25, GNR@PDA50, and GNR@PDA70. (L) UV–vis–NIR absorption spectra of GNR and GNR@PDAs. Gray, red, blue, green, and purple lines represent GNR, GNR@PDA15, GNR@PDA25, GNR@PDA50, and GNR@PDA70, respectively. The inset image is the magnified absorption spectra from 800 to 1350 nm. The error bar represents standard deviation of five measurements.
