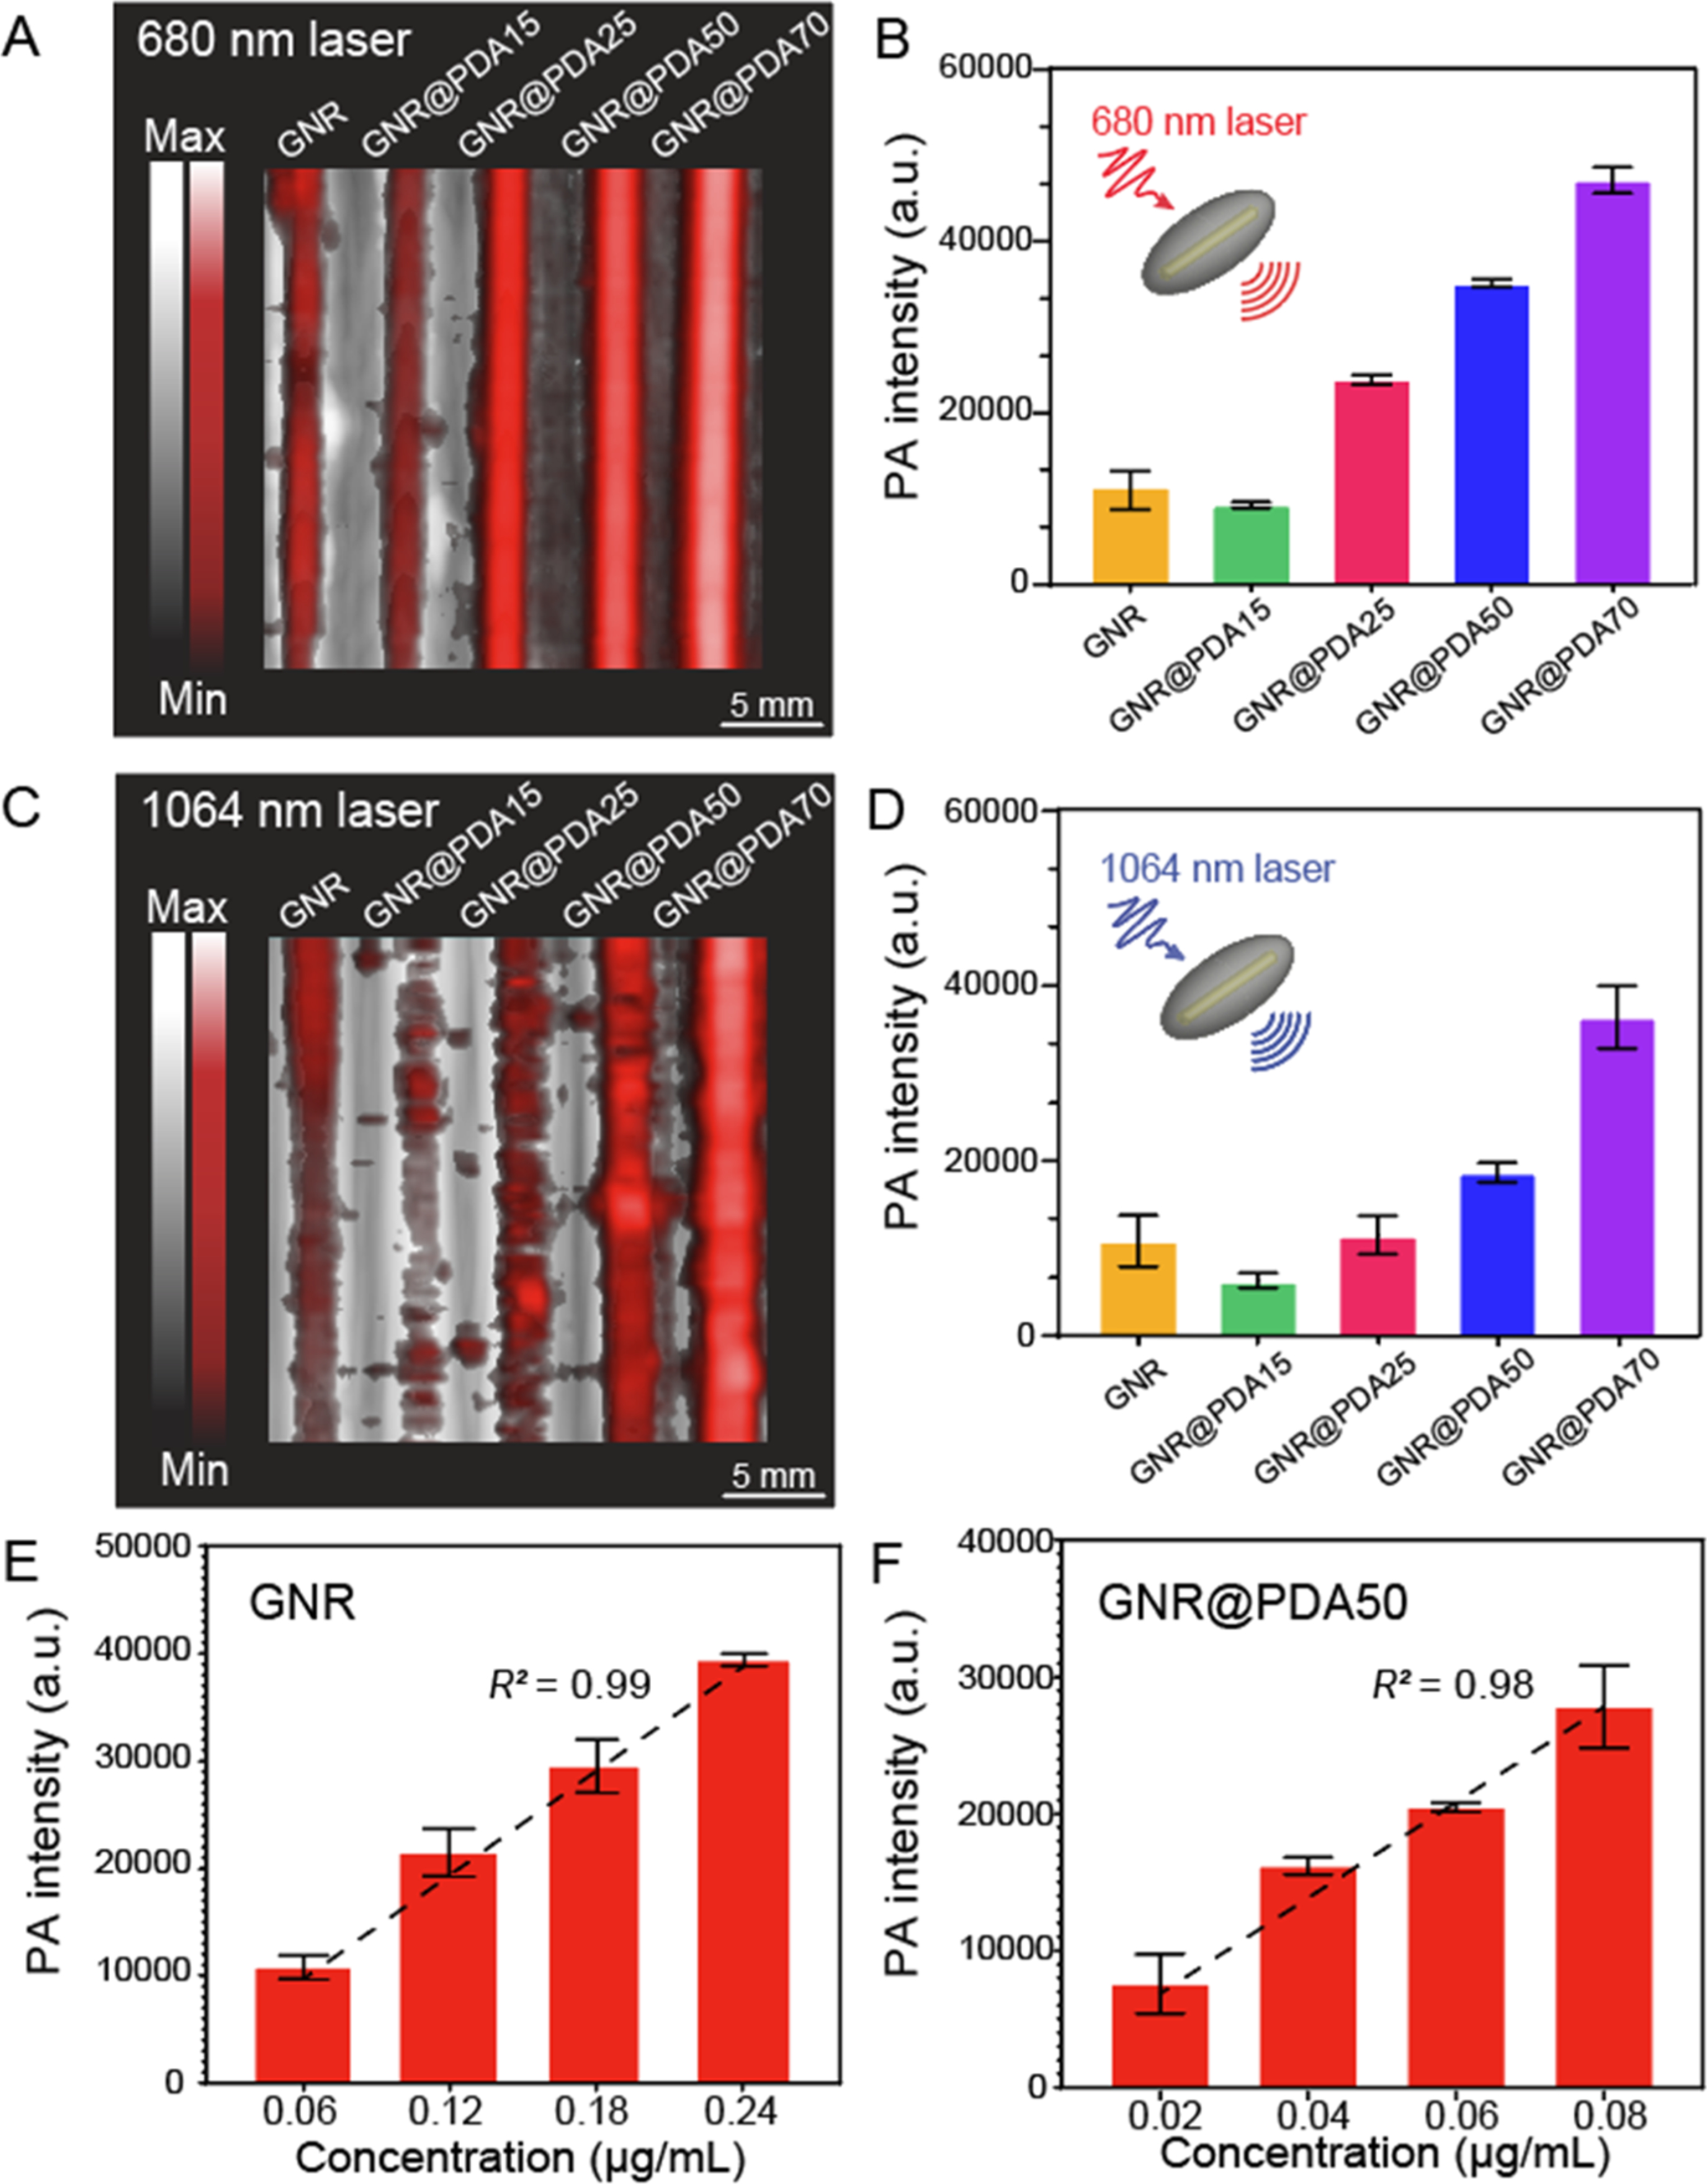
Figure 3.

PA performance of GNR and GNR@PDA. (A,B) PA image and its corresponding PA intensity when illuminated by a 680 nm laser. (C,D) PA image and its corresponding PA intensity when illuminated by a 1064 nm laser. GNR@PDAs showed a higher PA signal amplitude than pristine GNRs. (E) PA intensity of GNR and (F) PA intensity of GNR@PDA50 with the elevated concentration when illuminated by a 1064 nm laser. Figure S7 shows the PA intensity of GNR@PDA50 irradiated by a 680 nm laser. The error bars represent the standard deviation of five regions of interest.
