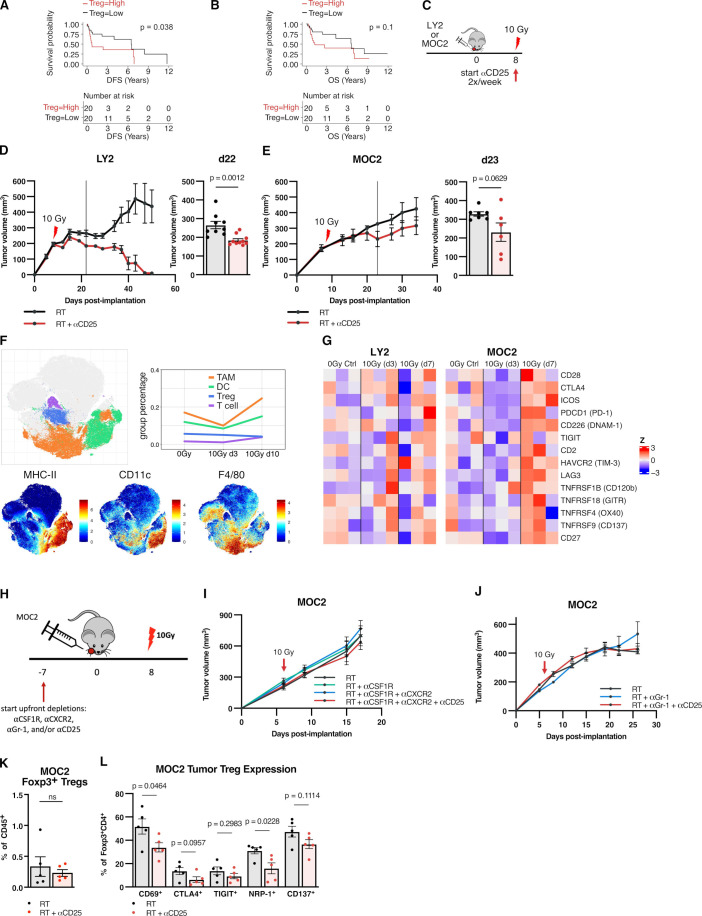
Figure 1.
High Tregs correlates with poor outcomes in oral cavity cancer, but response to Treg targeted therapy in preclinical models varies by tumor type and does not respond to myeloid depletion strategies. (A) Disease-free survival of 40 human OSCC patients, split into two cohorts Treg high (n=20) vs Treg low (n=20) based on combined median splits of normalized levels of FOXP3, IL-2RA and TGFB1 transcript expression. (B) Overall survival of human OSCC patients, Treg high (n=20) vs Treg low (n=20). (C) Experimental procedure for RT +anti-CD25 treatment in LY2 and MOC2 tumor models. (D) Tumor growth curves for mice treated with RT (n=9) vs RT +anti-CD25 (n=10) in LY2 tumor model and replicate values 22 days postimplantation (p=0.0012, unpaired two-tailed t-test). (E) Tumor growth curves for mice treated with RT (n=9) vs RT +anti-CD25 (n=10) in MOC2 tumor model and replicate values 23 days postimplantation (p=0.0629 by unpaired two-tailed t-test). (F) t-SNE plots from CyTOF analysis of MOC2 tumors harvested 3 and 10 days post-RT compared with 0 Gy controls depicting expression of total singlet CD45+ cells; expression plot of MHC-II, CD11c, and F4/80; line chart for average proportion of TAM, DC, Treg and T cell populations (n=3 mice/group). (G) Heatmap of gene expression Z-scores of genes encoding costimulation and coinhibition markers from LY2 and MOC2 tumors harvested three or 7 days post-RT compared with 0 Gy controls (n=3 mice/group). (H) Experimental procedure for RT, anti-CSF1R, anti-CXCR2, anti-Gr-1 and/or anti-CD25 treatment in MOC2 tumor model. (I) Tumor growth curves for mice treated with RT, anti-CSF1R, anti-CXCR2, anti-Gr-1 and/or anti-CD25 in MOC2 tumor model (n=8 mice/group). (J) Tumor growth curves for mice treated with RT, anti-Gr-1 and/or anti-CD25 in MOC2 tumor model (n=8 mice/group). (K) Proportion of CD45+CD3+CD4+Foxp3+ cells in MOC2 tumors harvested 13 days post-RT with RT +/–anti-CD25 treatment (n=5 mice/group). (L) Proportion of CD45+CD3+CD4+Foxp3+ cells in MOC2 tumors harvested 13 days post-RT with RT +/–anti-CD25 treatment expressing indicated markers (n=5 mice/group, unpaired two-tailed t-test). CSF1R, colony-stimulating factor 1 receptor; CyTOF, cytometry by time-of-flight; DC, dendritic cell; IL-2, interleukin 2; RT, radiation therapy; TAM, tumor-associated macrophage; TGFB1, transforming growth factor-β 1; Treg, regulatory T cell; t-SNE, t-distributed stochastic neighbor embedding.

