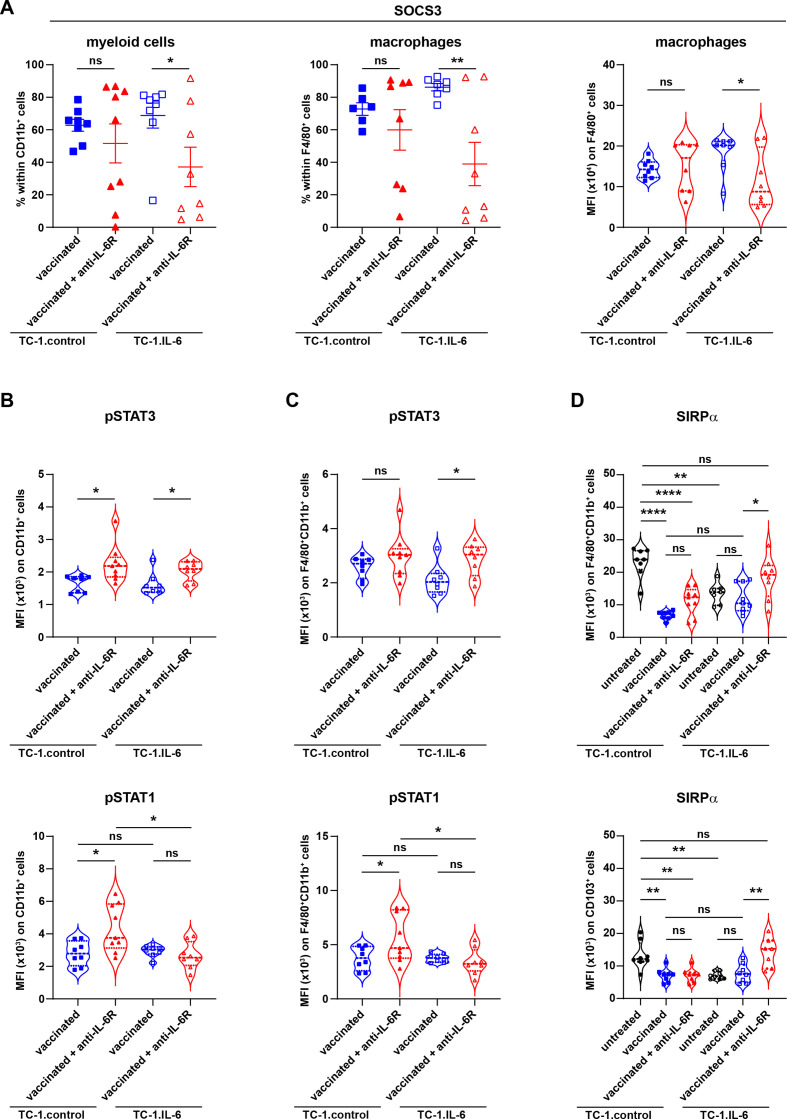
Figure 6.
IL-6 blockade decreases the levels of SOCS3 and increases SIRPα levels. (A) The percentage of intratumoral SOCS3+CD11b+ (myeloid cells) and SOCS3+F4/80+ (macrophages) cells and mean fluorescent intensity (MFI) of SOCS3 on macrophages. (B) MFI of pSTAT3 and pSTAT1 on total CD11b+ myeloid cells and F4/80+CD11b+ macrophages. (C) MFI of SIRPα on F4/80+CD11b+ macrophages and CD11b-CD103+ (cDC1) cells. Scatter plots indicate mean values with SEM each dot represents data from an individual mouse. Violin plots show the full distribution of the data, each dot representing an individual mouse. Data are representative of one experiment. Significance (A–C) in differences in the indicated vaccine-associated percentage of indicated cell infiltration or mean fluorescence intensity of indicated markers on cells due to IL-6R blockade was determined by Student’s t-test within each tumor model. Significance between groups in D is determined by one-way ANOVA. *P<0.05; **p<0.01; ****p<0.0001. ANOVA, analysis of variance; SIRPα, signal-regulatory protein alpha; SOCS3, suppressor of cytokine signaling 3.

