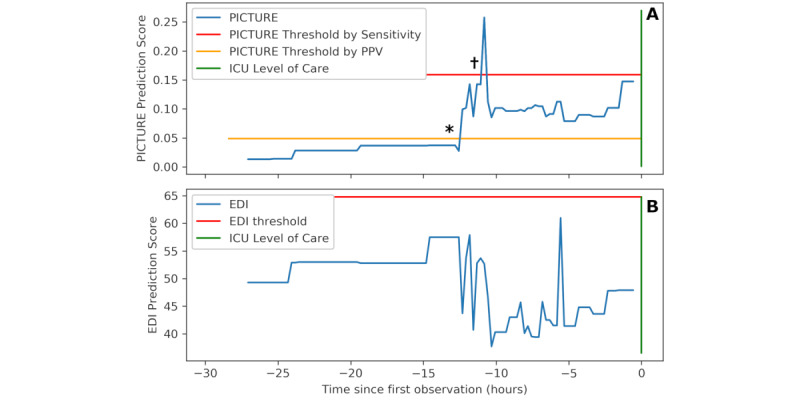
Figure 6.

Sample trajectory of one patient. Panel A depicts the PICTURE predictions over 27 hours before the patient is eventually transferred to an ICU level of care (green bar). Two possible alert thresholds are noted: one (red: 0.165) based on the EDI’s sensitivity at a threshold of 64.8 (as suggested by Singh et al [11]), while the other (yellow: 0.048) is based on the EDI’s PPV at this threshold. Note that PICTURE peaks above the sensitivity-based threshold approximately 11 hours in advance of the ICU transfer and then remains elevated over the PPV threshold until the transfer occurs. * and † represent the first time points that PICTURE crossed each threshold, referenced in Table 7. Panel B demonstrates the EDI over the same time range, with the threshold of 64.8 suggested by Singh et al [11]. The EDI did not identify this patient as being at risk. EDI: Epic Deterioration Index; ICU: intensive care unit; PICTURE: Predicting Intensive Care Transfers and Other Unforeseen Events; PPV: positive predictive value.
