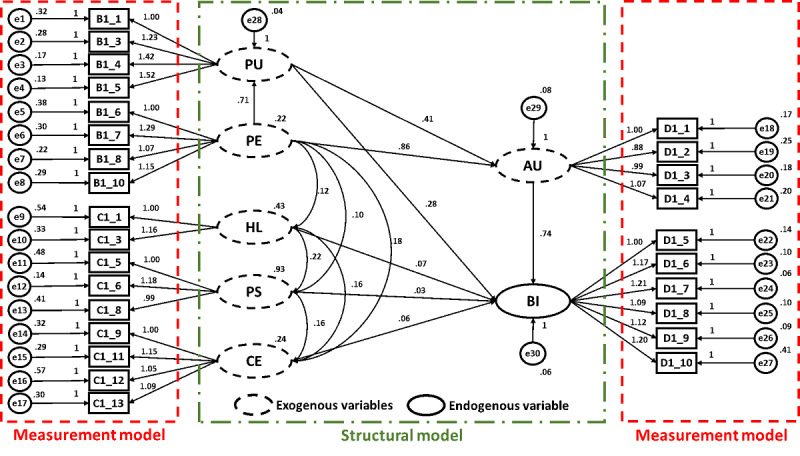
Figure 7.

Path diagram of the research framework. Measured items are illustrated in rectangles (eg, B1_1); latent variables are illustrated in ovals (eg, PU); smaller circles illustrate the error of measurement (eg, e1); associations are illustrated by arrows that indicate the direction of prediction. Factor loadings are noted next to the items. Coefficients are noted for each association (ie, directional arrow). AU: attitude toward use; BI: behavioral intention to use; CE: computer self-efficacy; HL: health literacy; PE: perceived ease of use; PS: privacy and security; PU: perceived usefulness.
