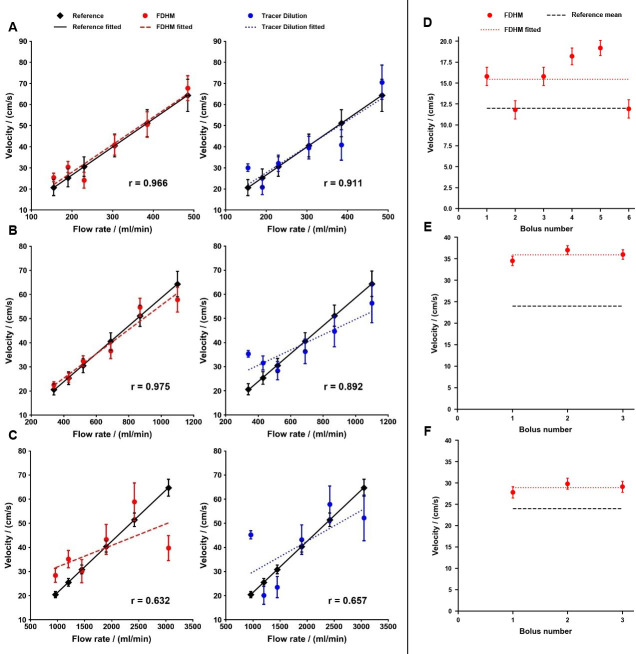
Fig 5. Computed velocities in comparison to the reference values of experiment A and B.
Starting with experiment A, the first six plots show the velocities for the FDHM method and the tracer dilution method for glass tubes with an inner diameter of (A) 4 mm, (B) 6 mm and (C) 10 mm. The 4 mm diameter glass tube showed the best agreement for both algorithms, closely followed by the 6 mm diameter glass tube. The results were considerably inferior for the 10 mm diameter glass tube. The last three plots represent experiment B: Applying the correction factor of setting 2 on the measurements of setting 3 (D) and setting 4 (E) yields a mean relative error of 28% and 48% compared to the reference values, respectively. The lowest mean relative error of 20% is achieved when using the correction factor of setting 3 for setting 4 (F). Error bars emerge from the error of the mean of the correction factors.

