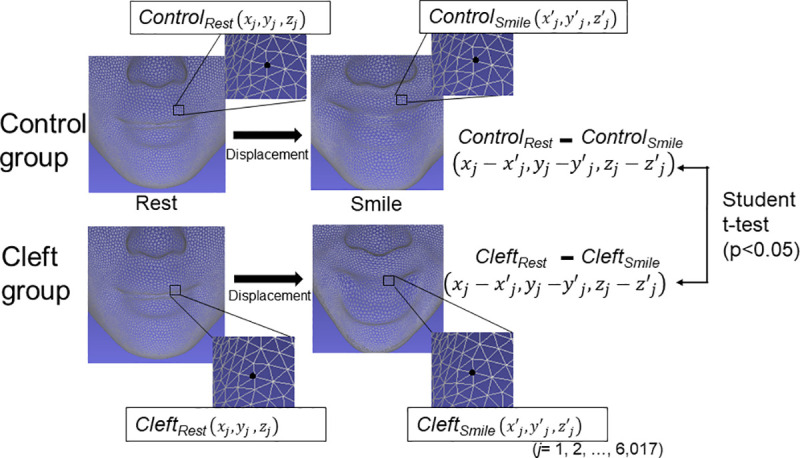
Fig 3. Schematic illustration of the statistical comparison of the displacements from a rest position to the peak maximum smile position between the Control group and Cleft group.

Controlrest faces at rest in the Control group; Controlsmile, faces at the peak of smiling in the Control group; Cleftrest, faces at rest in the Cleft group; Cleftsmile, faces at the peak of smiling in the Cleft group.
