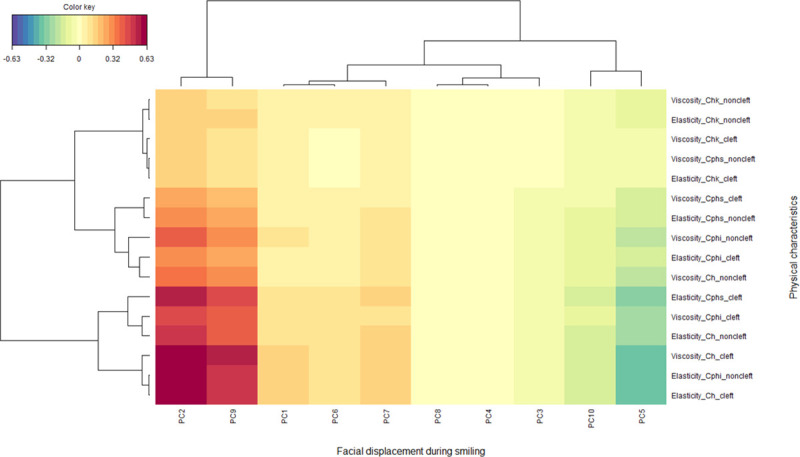
Fig 8. Heatmap showing the correlation between the facial displacement while smiling, represented as the principal component (PC), and the physical characteristics of the skin according to a canonical correlation analysis.

The X-axis depicts the 3D facial displacement while smiling represented as PCs 1–10 and the Y-axis the viscoelasticity of the skins tested. The red and blue colors indicate strong positive and negative correlations, respectively, whereas yellow indicates weaker correlation values (see color key). The “mixOmics” tool as part of the R software package was used to draw this figure.
