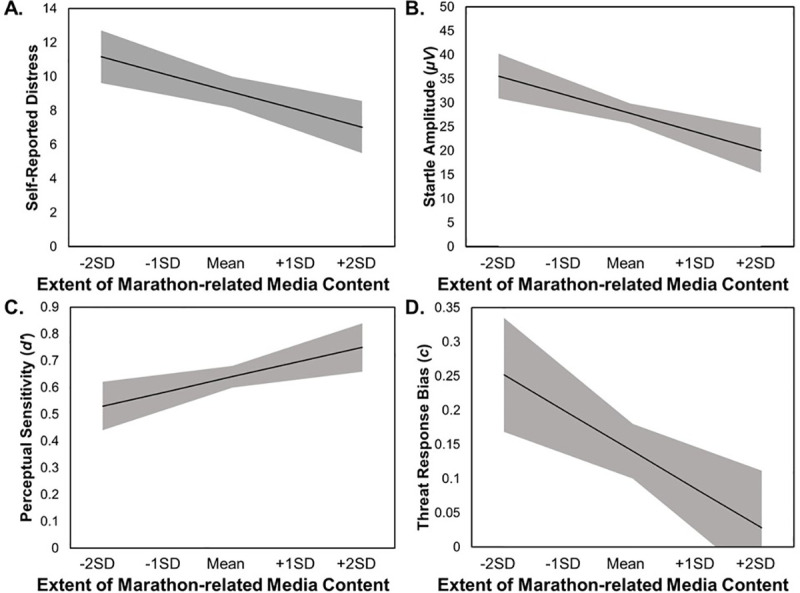
Fig 2.

Simple slopes representation of models predicting changes in distress (Panel A), startle reactivity (Panel B), perceptual sensitivity (Panel C), and Threat response bias (Panel D) by changes in the extent of recent marathon-related coverage. Extent of recent marathon-related media coverage was calculated to be time-locked for each participant at each Wave to include only media coverage from the two weeks prior to that participant’s laboratory visit. Model slopes are represented by a black line, with ±1 standard error of the slope and intercept for each model shown as a gray-shaded area. SD stands for standard deviation. The model for perceptual sensitivity (Panel C) is plotted at the within-person mean for threat response bias, and the model for threat response bias (Panel D) is plotted at the within-person mean for perceptual sensitivity.
