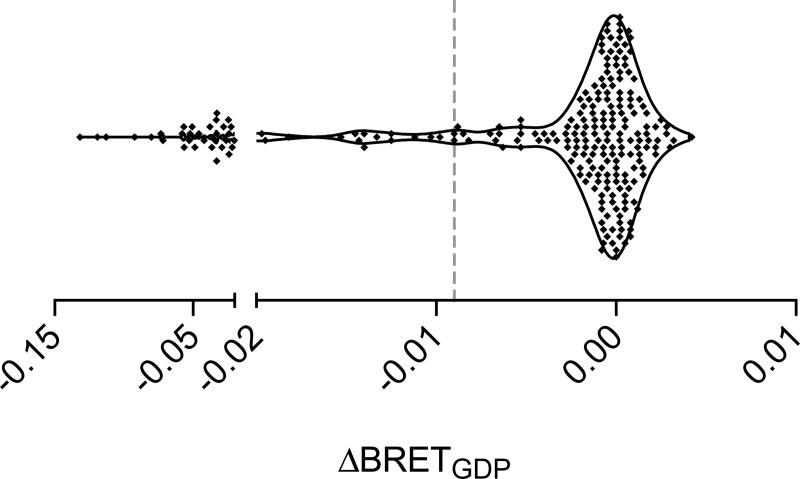
Fig 2. Determination of threshold ΔBRETGDP.
Most receptor-G protein pairs did not interact, and values of ΔBRETGDP were distributed around zero. Values to the left of the dashed vertical line (ΔBRETGDP = -0.009) were identified as outliers from this background distribution (i.e. coupled pairs) with a false discovery rate (FDR) of 1%. Each point represents a single receptor-G protein pair, and the mean of three independent experiments performed in duplicate.

