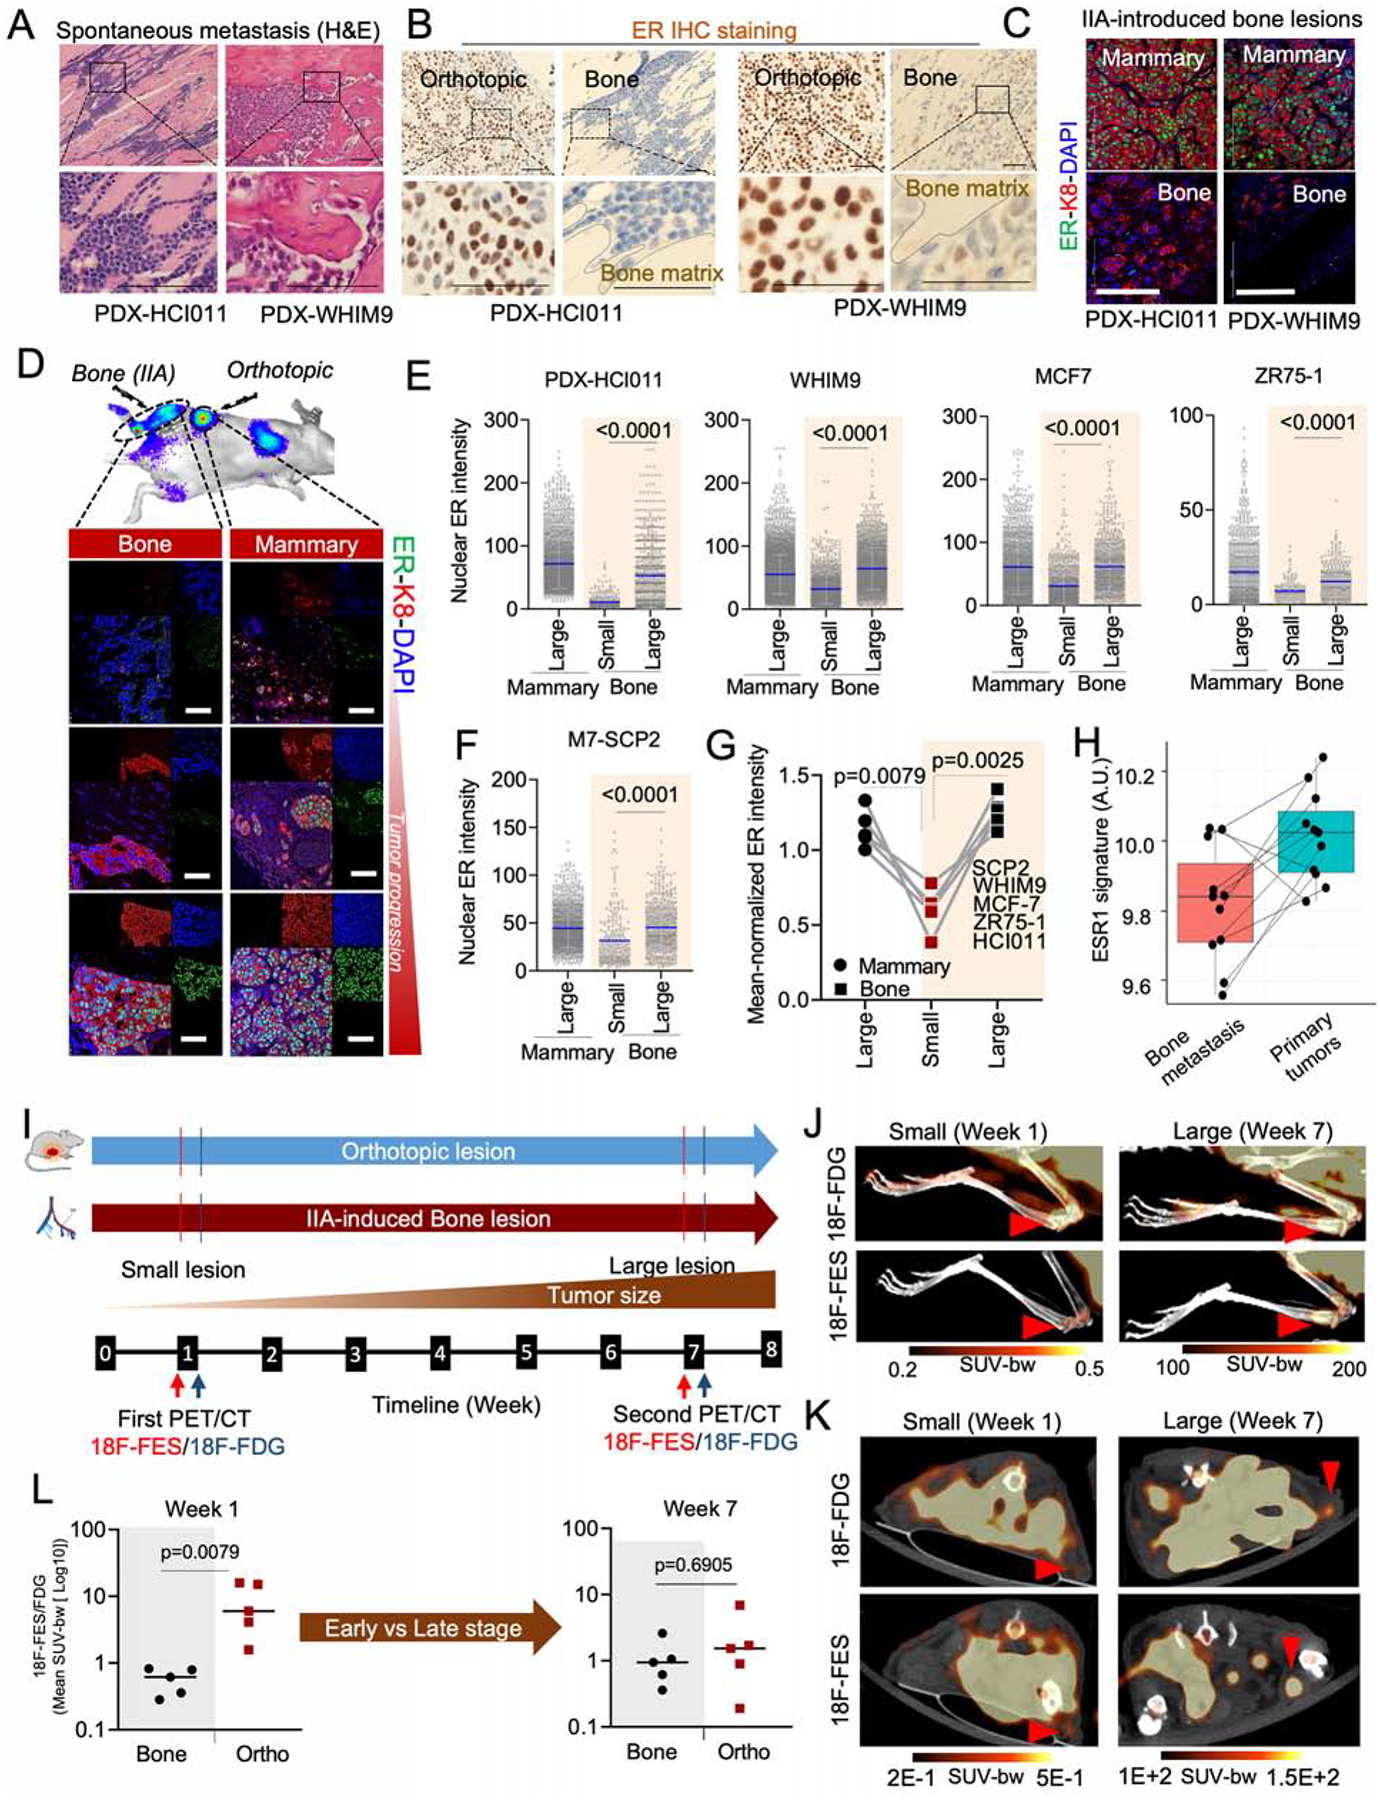
Figure 1: BME induces transient loss of ER expression in ER+ breast cancer cells.

A. H&E staining of spontaneous metastases of HCI011 and WHM9 tumors to spine and hind limb, respectively. Scale bar: 100μm.
B. Human-specific ER IHC staining are shown for spontaneous metastasis of HCI011 and WHIM9, respectively. Scale bar: 50μm.
C. IF staining of ER, keratin 8 (k8), and DAPI in orthotopic (mammary) and IIA-induced BoM models of ER+ PDXs (HCI011 and WHIM9). Scale bars: 100μm.
D. IF images of MCF7 cells following orthotopic and bone transplantation. Changes in ER expression are illustrated at different stages of tumor progression. Scale bars: 50μm.
E. Dot plot depicting nuclear ER intensity of single cells (SCs) in orthotopic and BoM specimens from PDXs (HCI011, WHIM9) and cell lines (MCF7, ZR75-1), following IF staining as illustrated in 1C and 1D (n=3–6 mice per model).
F. Dot plot depicting nuclear ER intensity of SCs in orthotopic and BoM specimens from M7-SCP2. Bone lesions were classified into “small” and “large” as defined in (E); (n=4 mice).
G. Connected scatterplots showing the mean-normalized ER intensity of all cancer models used from Figure 1E to 1F. (n= 5 cell lines).
H. Boxplot depicting changes in ESR1 early signature in matched BoM and primary specimens from BC patients (https://github.com/npriedig/).
I. Scheme describing the PET-CT experiment on MCF7 orthotopic or IIA-induced BoM models. 18F-FES and 18F-FDG imaging were performed 48h apart, at week 1 and 7 post tumor transplantation.
J. PET/CT scans showing the maximum intensity projection (MIP) of 18F-FDG and 18F-FES in bone as described in I. MCF7 BoMs were generated using IIA injection. Red arrows indicate tumor location. Scale: 0.2–0.5 SUV-bw (week 1) and 100–200 SUV-bw (week 7).
K. Axial view of PET/CT scans depicting the uptake of 18F-FDG and 18F-FES in small and large lesions of MCF7 orthotopic tumors. Early time point (Week 1) and late time point (Week 7) were used to depict non palpable orthotopic tumor stage (small < 2mm) and the palpable tumor stage. Red arrows and scale: as in J.
L. Relative quantification of radiolabeled 18F-FES uptake in small and large lesions of orthotopic and BoMs. Each dot represents the mean standard uptake values (mean SUV-bw) of 18F-FES normalized to the mean SUV of 18F-FDG for each mouse. Mann Whitney U-test is used for statistical analysis; n=5 mice per group.
(A–L): P values were computed by two-tailed unpaired Student t-tests unless otherwise noted.
