
Figure 2: Tracing ER expression in bone metastases by evolving barcodes and ERE-reporter.
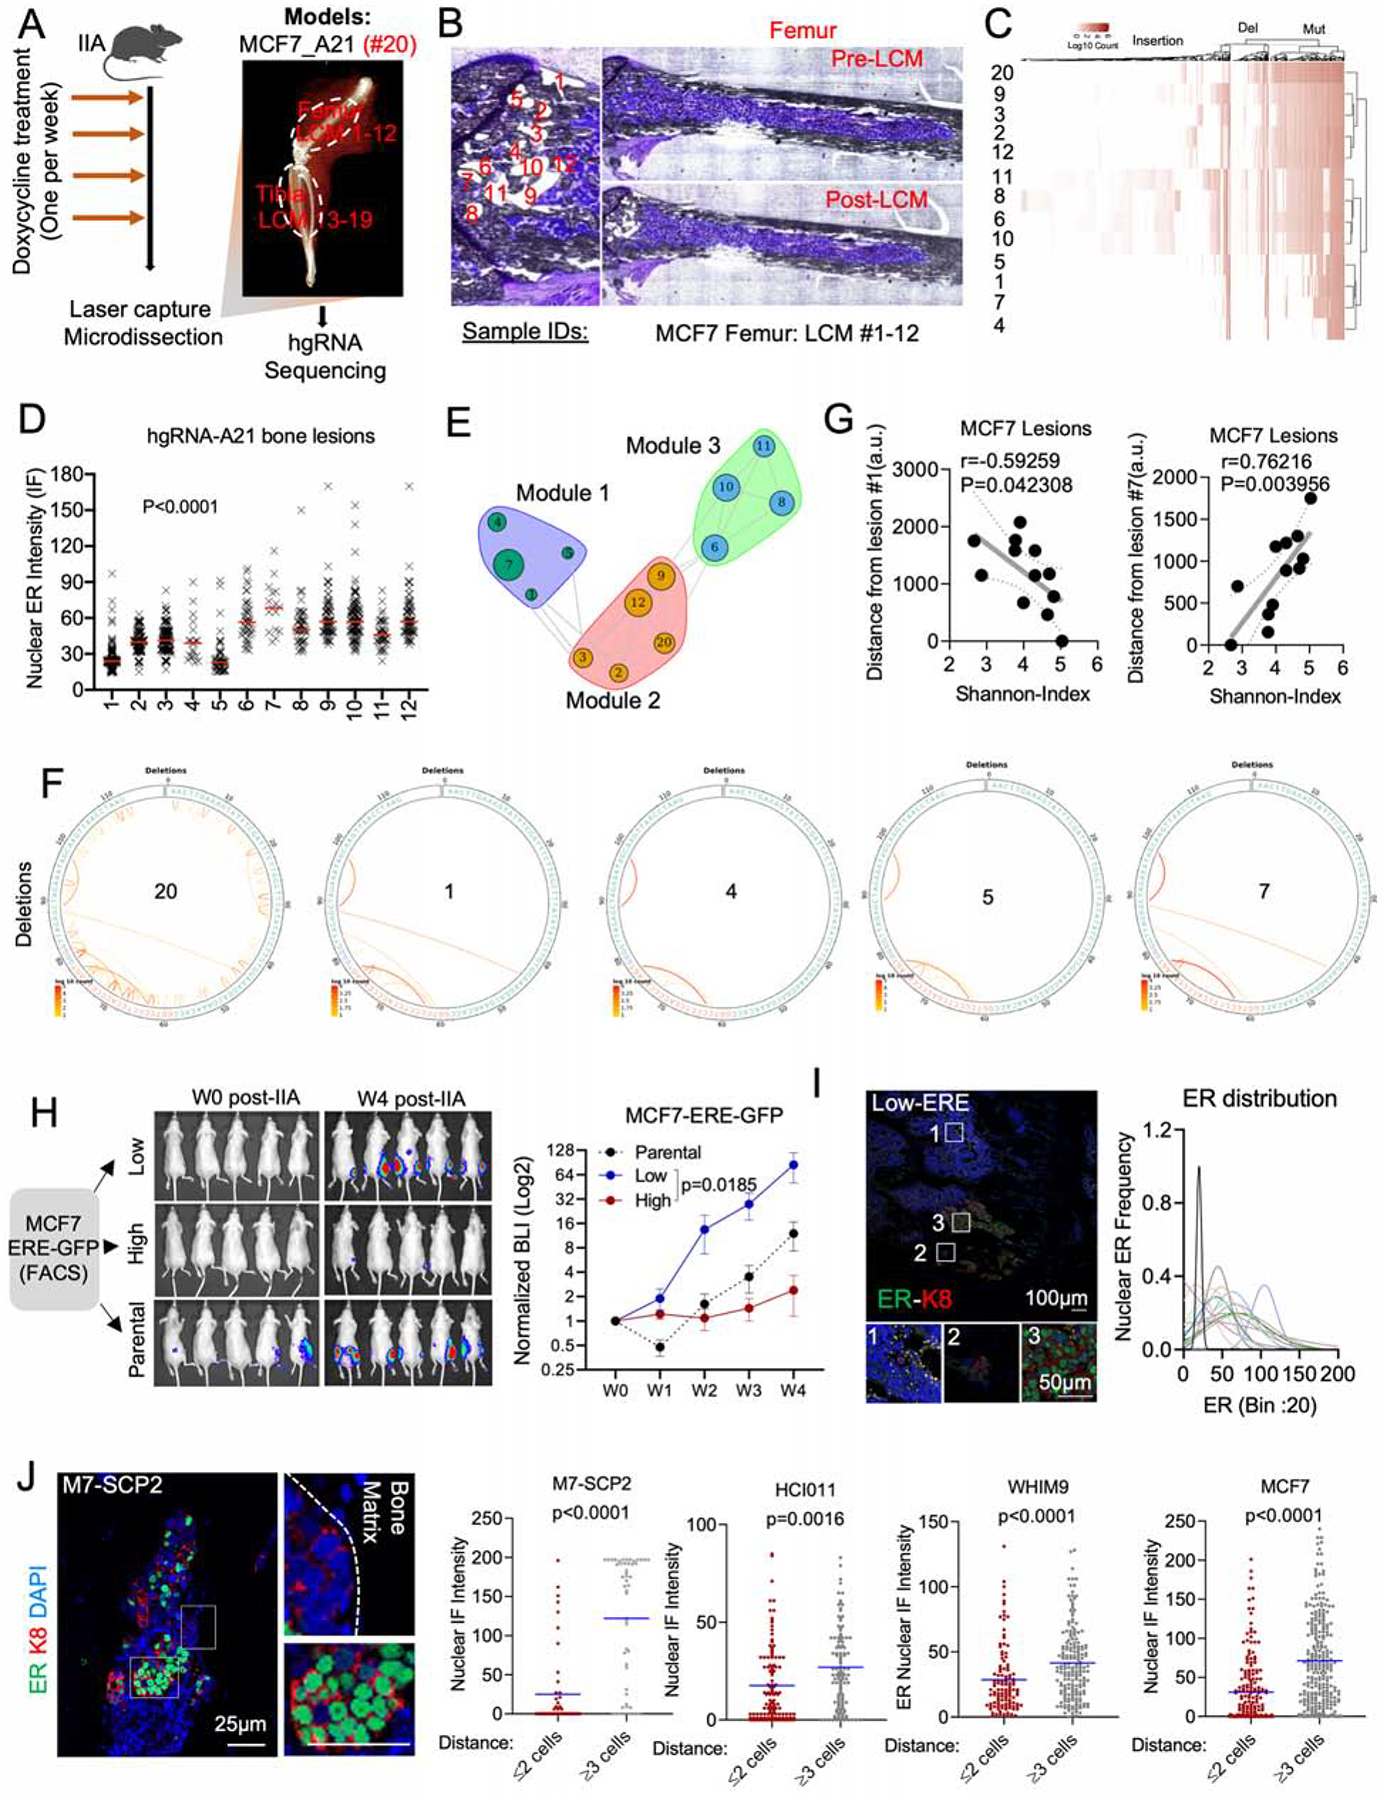
A. Experimental design of BoM lineage tracing using an inducible CRISPR-Cas9 hgRNA evolving barcoding system. iCas9-expressing MCF7 cells were stably transduced with homing guide RNA A21 (hgRNA-A21) before transplantation to bone and induced weekly for four weeks before LCM and targeted sequencing. We collected 19 lesions from femur (#1–12) and tibia (#13–19). Barcoded parental cells were labelled as #20.
B. Exact map of mouse femur before and after LCM of metastatic lesions #1–12.
C. Heatmap showing hierarchical clustering of bone lesions #1–12, based on hgRNA-A21 mutations.
D. IF quantification of SCs nuclear ER in lesions #1–12 (femur). (n=12 lesions); P value: Ordinary one-way ANOVA.
E. Modular organization of lesions #1–12 following a high-dimensional undirected analysis of barcode mutations. Node sizes represent mean intensity of ER expression.
F. Circus plot showing barcode deletions in bone lesions clustered in module 1 (see E). #20: pre-injected cells.
G. Scatter plot showing Pearson correlation (r) between the Shannon index of bone lesions and their relative distance to lesion #1 or #7. P value: two-tailed t-test.
H. IIA-induced BoM from ERE-GFP reporter MCF7 cells. ERE-GFPLow, and ERE-GFPhigh MCF7 cells were sorted based of their GFP expression. Tumor growth was measured by Bioluminescence. (n= 5–8 mice); P value: Two-Way ANOVA.
I. IF staining of ER in BoM derived from ERE-GFPLow MCF7 cells. The Gaussianized ER distribution is based on nuclear intensity of SCs; peak: mean ER expression per lesion.
J. IF staining depicting a spatial distribution of ER based on the location of M7-SCP2 lesions relatively to the bone matrix. Scale bars: 25μm. Dot plots represent nuclear ER expression in cells proximal (≤ 2 cell distance) or distal (≥3 distance) to the bone matrix. P values: two-tailed unpaired Student’s t-tests.