
Figure 3: OGs promote the loss of ER expression and reduction of ER activities during early stages of bone colonization.
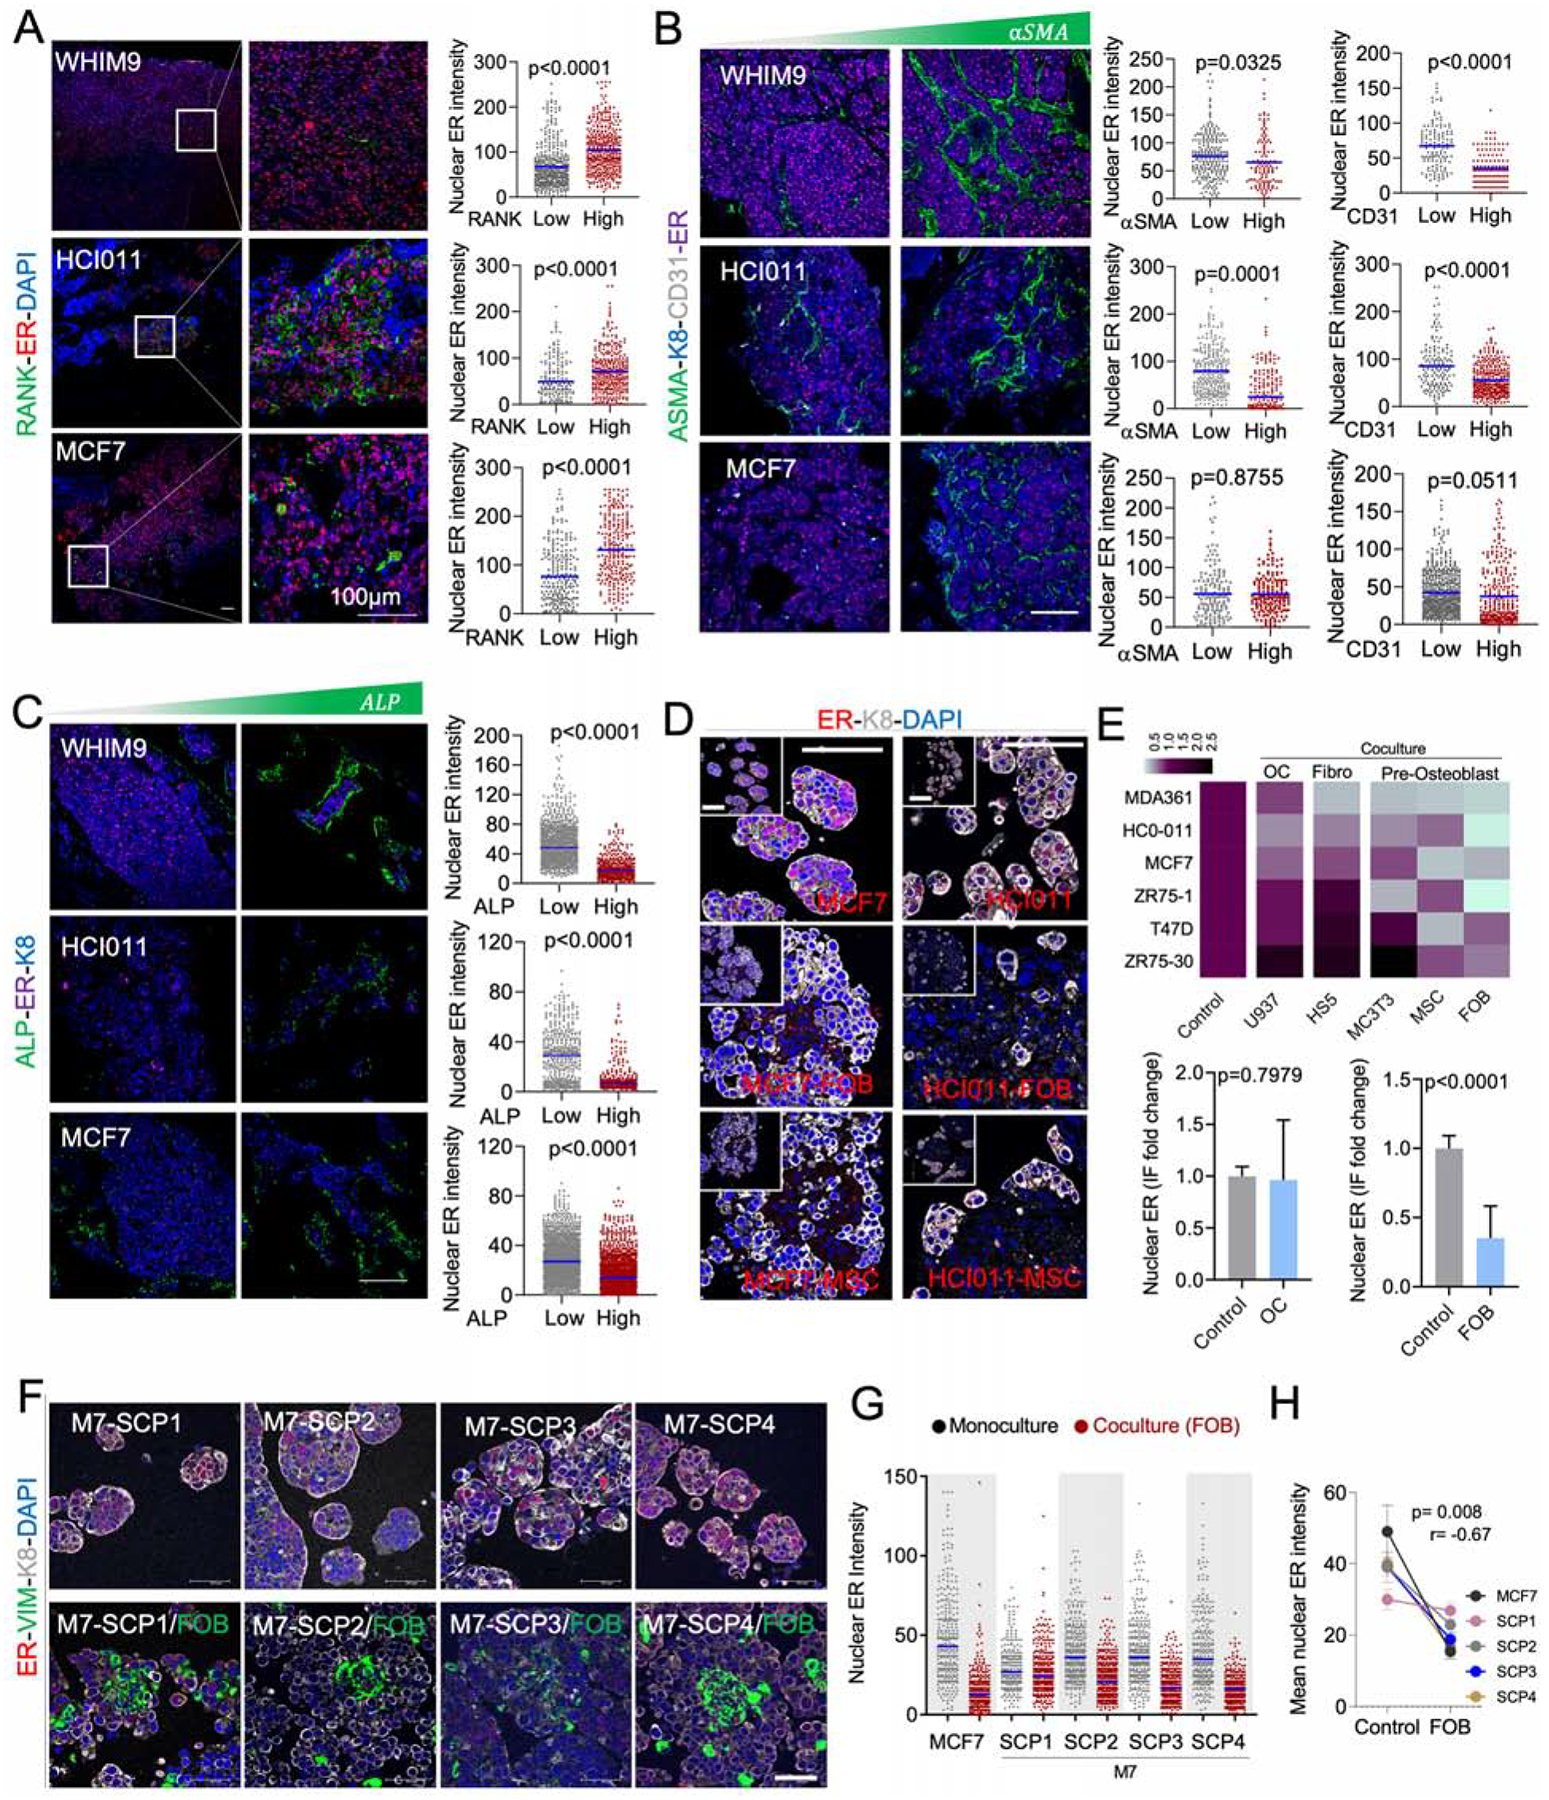
A. IF of BoMs showing ER expression in PDXs (HCI011 and WHIM9) and MCF7 cells, relatively to Receptor activator of nuclear factor-KB (RANK) expression in osteoclasts. Scale bars: 100μm. Dot plots show ER quantification in SCs. (n=3–5 lesions).
B. IF as in A. ER is co-stained with alpha smooth muscle actin (αSMA) and cluster of differentiation 31 (CD31) to depict endothelial cells. Dot plots show ER quantification in SCs. (n=3–5 lesions).
C. IF as in A. ER is co-stained with alkaline phosphatase (ALP). Dot plots show ER quantification in SCs. (n=3–5 lesions).
D. IF images of HCI011-derived primary cells and MCF7 cells in 3D monoculture and co-culture with FOBs and MSCs. Scale bars: 100μm.
E. Heatmap showing the mean intensity of ER in primary cells (HCI011) and BC cell lines (MDA-MB-361, MCF7, ZR75-1, T47D, ZR75-30) in 3D monoculture (control) or co-culture with osteoclast precursors (U937), bone marrow stromal cells (Hs5), mouse pre-osteoblasts (MC3T3), human mesenchymal stem cells (MSC) and human pre-osteoblast (FOB). Histogram shows ER expression in monoculture versus co-culture of multiple cell lines with U937 or FOB cells; (n=3 biological replicates). Error bars: mean +/− SD.
F. IF showing ER expression in M7-SCPs in 3D monoculture or co-culture with FOB cells. Vimentin (VIM). Scale bars: 50μm.
G. IF quantification of ER expression in M7-SCP1 to 4; (n = 3 biological replicates).
H. Graph representing ER expression in cancer cells alone or in co-cultured with FOB cells. Spearman correlation (r); (n = 5 cell lines); Error bars: mean +/− SE
(A–H): P values were computed by two-tailed unpaired Student t-tests unless otherwise noted.