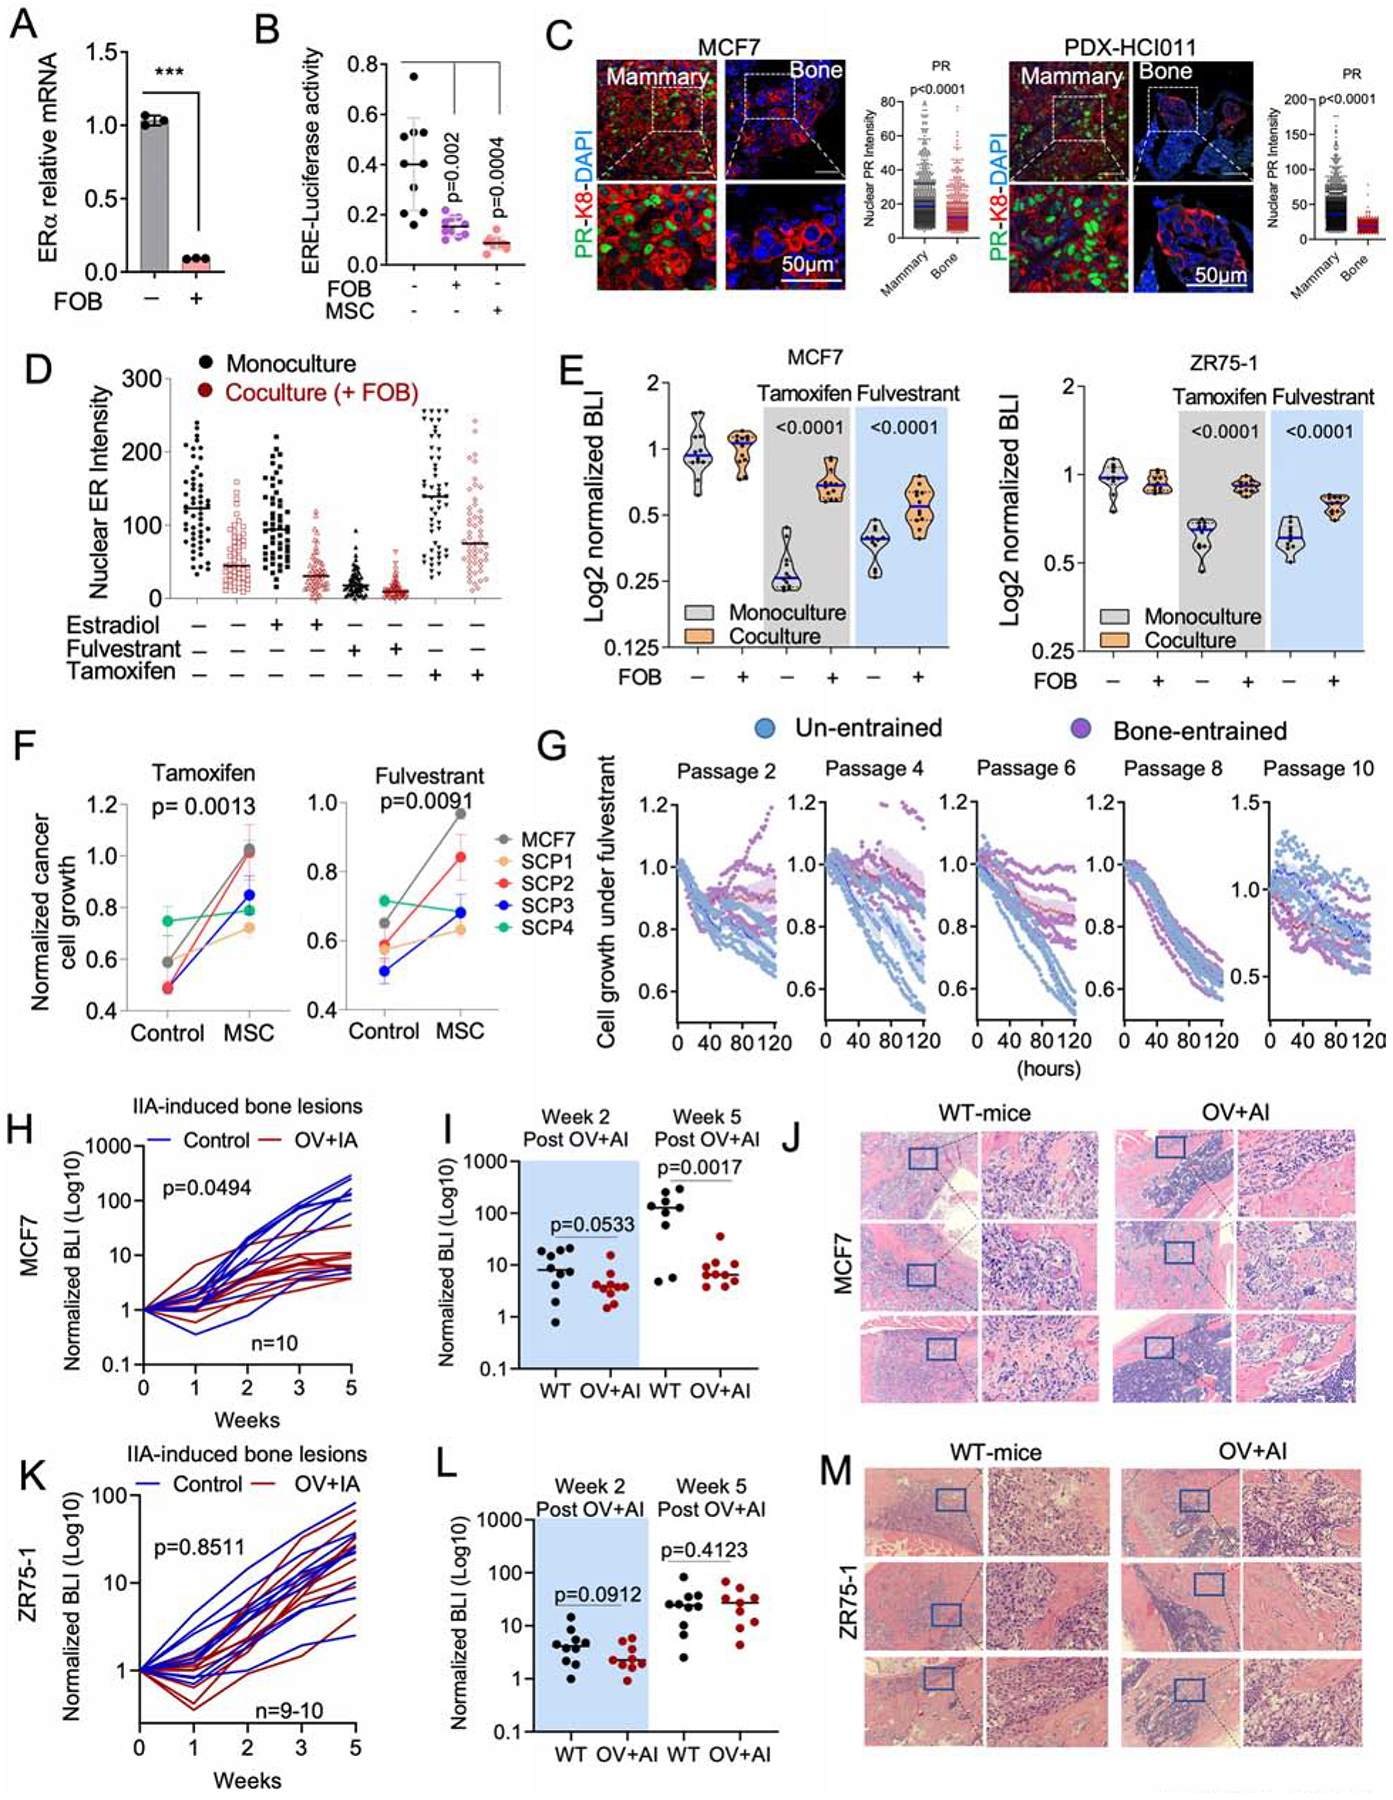
Figure 4: OGs confer endocrine resistance.

A. Relative mRNA expression of ESR1 in 3D monoculture or co-culture of MCF7 with FOB. Data result from FACS-sorted MCF7. (n=3 technical replicates).
B. Dot plot representing ER transcriptional activity in MCF7 cells expressing pGL2 ERE-luciferase reporter. MCF7 cells were cultured in 3D with or without OGs (FOB and MSC) for 7 days. (n=10 technical replicates); Error bars: mean +/− SD.
C. Confocal images showing the expression of progesterone receptor (PR) in IIA-induced BoM from MCF7 and HCI011. Dot plots show nuclear PR IF intensity. (n=3 lesions).
D. Dot plots depicting ER intensity in 3D mono- and co-culture of MCF7 cells with FOB following 24 hours treatment with 10nM 17β-estradiol, 20nM fulvestrant and 100nM 4-Hydroxytamoxifen (tamoxifen); n=5 fields.
E. Violin plot showing the response of luciferase-labelled MCF7 and ZR75-1 cells to 100nM of 4-Hydroxytamoxifen (Tamoxifen) and 20nM of fulvestrant in 3D mono- or co-culture with OGs (FOB). Bioluminescence was acquired 72 hours post-treatment. (n=12 and 10 technical replicates for and ZR75-1).
F. Graphs representing the proliferation of MCF7 cells and M7-SCP1-4 in monoculture and MSC co-culture following 1 week of treatment with 20nM fulvestrant or 100nM tamoxifen; n= 5 cell lines.
G. Time course experiment depicting growth kinetics of un-entrained and bone-entrained M7-SCP2 cells in vehicle or 20nM fulvestrant conditions; n=6 technical replicates.
H. Growth curve showing response of IIA-induced MCF7 BoMs to estrogen depletion. Ovariectomized (OV) mice were additionally treated with Letrozole (OV+AI), daily. Results are based on BLI. (n=10 mice); P value: Two-Way ANOVA.
I. Dot plot showing BoM growth in wild-type (WT) and OV+AI mice at week 2 and week 5 post tumor transplantation; n=10 mice. P value: two-tailed unpaired Student’s t-test.
J. H&E staining showing MCF7 metastatic lesions in wild-type (WT) and “OV+AI” groups.
K. Growth curve depicting the response of ZR75-1-derived BoM as in H. (n=9–10 mice); P value: Two-Way ANOVA.
L. Dot plot showing statistical growth differences in ZR75-1 as in I.
M. H&E staining of ZR75-1 metastatic lesions as in J.
(A–M): P values were computed by two-tailed unpaired Student t-tests unless otherwise noted.
