
Figure 6: Osteogenic cell-secreted FGFs promote endocrine resistance.
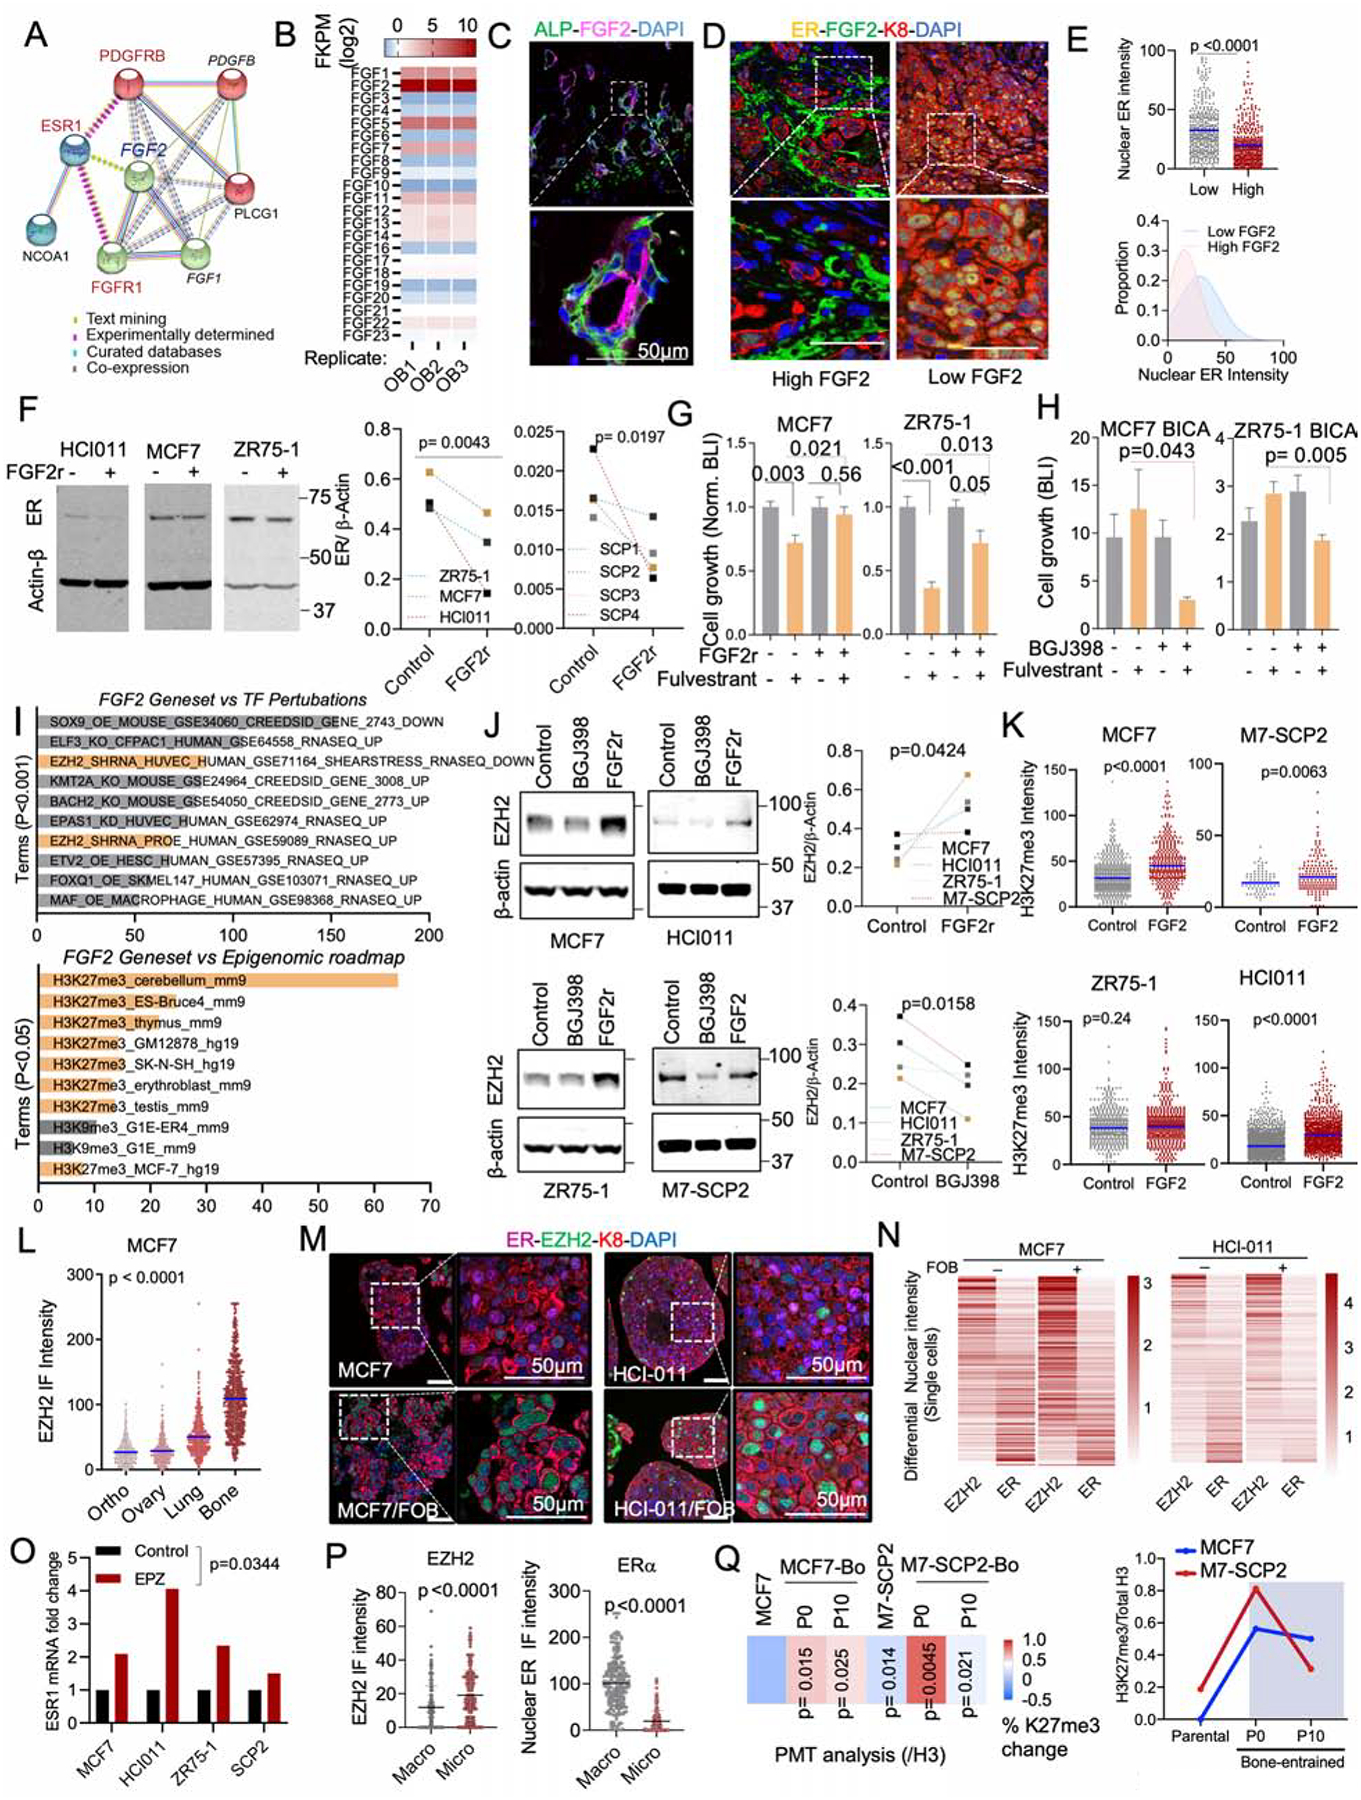
A. Network depicting functional protein association between FGFR1, PDGFRB and ER using the STRING database. Kmeans clustering (k=3) was used to represent 3 major centroids (depicted as red, green, and cyan spheres) and their most closely associated proteins based on unsupervised data mining.
B. Graph showing the expression of all human 22 fibroblast growth factor (FGF) family proteins (FGF1–23) in OGs (FOB) RNA sequencing dataset (n=3 technical triplicates).
C. IF images of Alkaline Phosphatase (ALP) and basic fibroblast growth factor (FGF2/bFGF) in normal bone tissue. Nuclei is shown in blue (DAPI). Scale bar: 50μm
D. IF images showing decreased ER expression in tumors established in FGF2 enriched BME.
E. The scatter dot plot represents ER quantification from tumors according to FGF2 enrichment (Low and High) in adjacent stromal cells (n=3–4 lesions). Mean expression is represented in blue. The Gaussian curve simulates ER distribution based on nuclear intensity. Peaks: mean expression of ER.
F. Immunoblots depicting the effect of recombinant FGF2 (20ng/ml) on ER expression in multiple BC models including PDX HCI011. Cells were treated for 24h. ER expression was summarized as connected dot plot graphs; n = 3 and 4 cell lines. P values: one-tailed unpaired Student t-tests.
G. Histogram showing effect of recombinant FGF2 (20ng/ml) on MCF7 and ZR75-1 cell growth in 3D; n=6 technical replicates.
H. Bone-In-Culture-Array (BICA) assay showing synergistic effects between 2.5μM pan FGFR inhibitor (BGJ398) and 20nM fulvestrant in MCF7 and ZR75-1 models. n=6 technical replicates.
I. Annotated bar plot showing the association of histone modifications with basic FGF (FGF2) gene signatures using the Enrichr platform (https://amp.pharm.mssm.edu/Enrichr/). Processed ChIP-sequencing data was obtained from epigenomic roadmap project (Roadmap Epigenomics Consortium et al., 2015). Histograms represent the association score with FGF2 signaling. Signatures are sorted based on P value ranking. Only p values < 0.05 and <0.01 were shown for the top and bottom panel, respectively.
J. Immunoblotting showing alteration of EZH2 expression in multiple cells following a 24h treatment with 1μM pan FGFR inhibitor (BGJ398) or 20nM FGF2 recombinant (FGF2r). Primary cells generated from HCI011 (ER+ PDX) were cultured in 3D and treated with 1μM pan FGFR inhibitor (BGJ398) or vehicle for 24h. Normalized EZH2 expression (/β-actin) was shown as dot plots. (n=4 cell lines); P value: one-tailed unpaired Student t-test.
K. Dot plots depicting the effect of 20nM recombinant FGF2 on H3k27me3 of multiple ER+ BC 3D models, based on quantified IF images (n=3 technical replicates). P values: One-tailed paired Student t-tests.
L. IF quantification of EZH2 expression in paired metastases and orthotopic tumor. MCF7 cells were transplanted to bone and to mammary gland of nude mice, which led to tumor formation at multiples sites including lung, ovary, bone and mammary gland. Metastatic tissues were harvested for IF quantification and shown as a dot plot graph. (n=3 images); Mean expression of EZH2 is indicated in blue.
M. IF showing co-expression of ER and EZH2 in 3D monocultures and co-cultures (+FOB) models of MCF7 and PDX HCI011. Scale bars: 50μm.
N. Heatmap showing relative expression of nuclear ER and EZH2 in MCF7 and PDX HCI011 SCs as depicted in M.
O. Effect of the EZH2 inhibitor EPZ011989 on ESR1 mRNA expression after 24 hours of treatment; n=4 cell lines.
P. Dot plots showing IF quantification of EZH2 and ER in MCF7 BMMs and macrometastases (n= 3–5 lesions).
Q. Reversibility of epigenetic changes based on post-translational modification (PTM) analysis. The percent changes in H3k27me3 between parental cells (MCF7), M7-SCP2 and bone-derived (MCF7-Bo and M7-SCP2-Bo) after multiple passages in vitro (Passages: P0 and P10). (n=4 biological replicates); P values are relatively to parental cells. The right panel depicts the temporal epigenetic changes (H3k27me3/H3)
(A–Q): P values were computed by two-tailed unpaired Student t-tests unless otherwise noted.