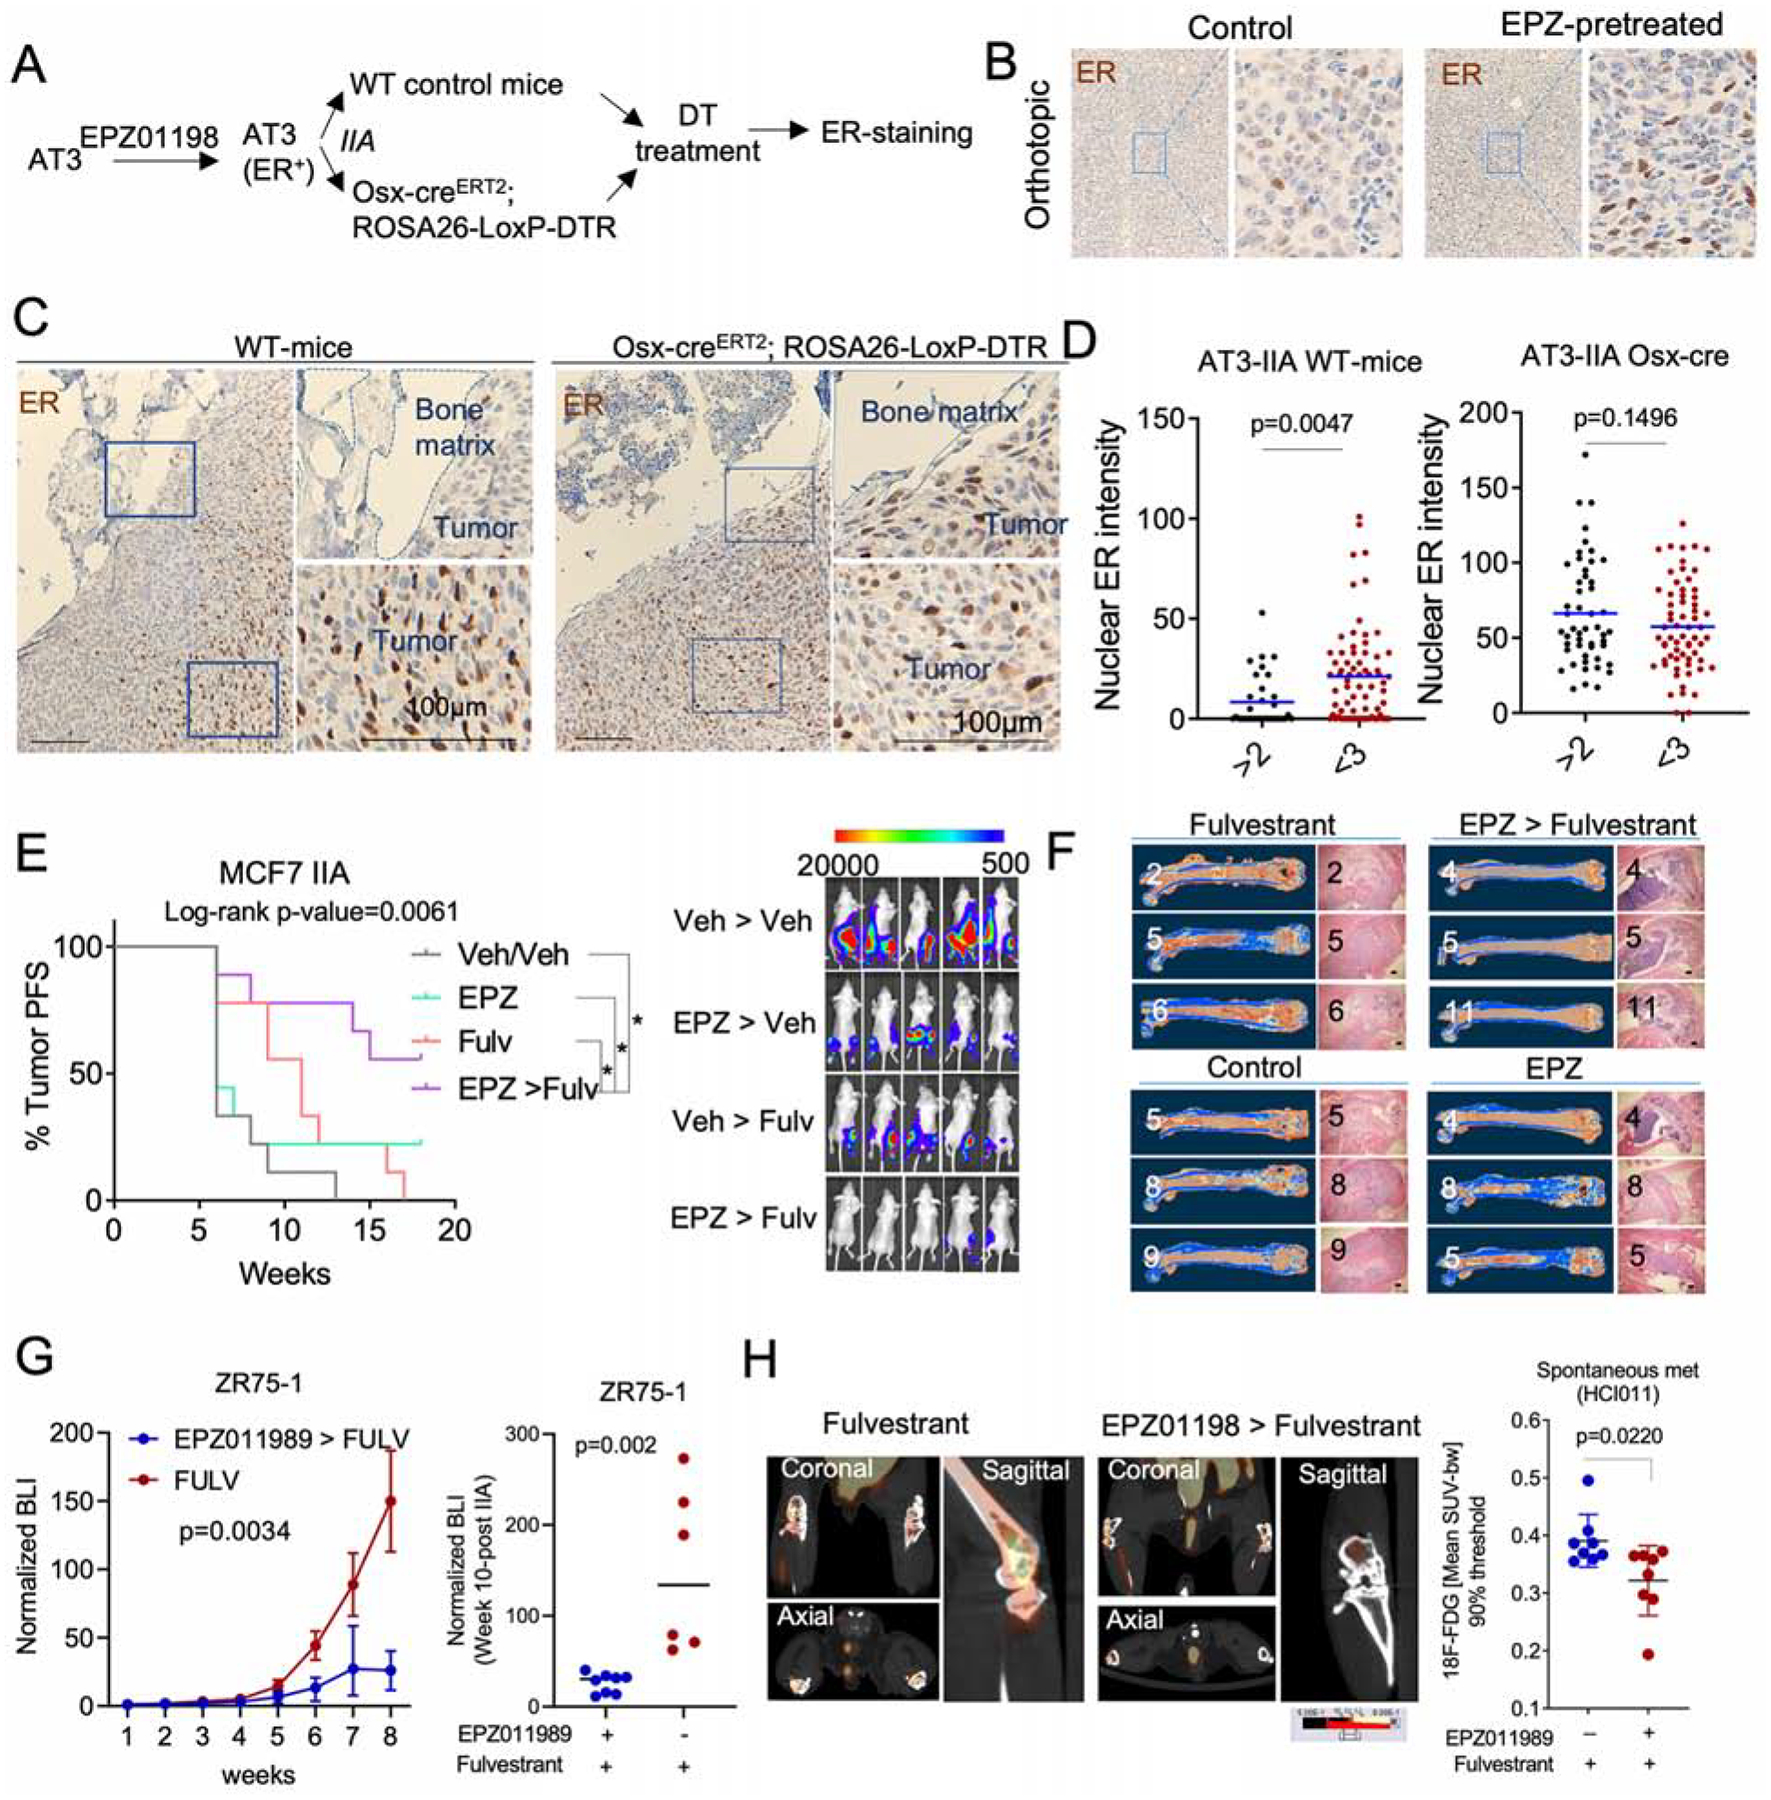
Figure 7: EZH2 integrates multiple signals from BME and drives the phenotypic shift of ER+ breast cancer cells.

A. Scheme to evaluate ER loss in syngeneic murine models. AT3 cells were pre-treated with EZH2 inhibitor (EPZ011989) for 2 weeks before being transplanted to bone of wild-type or osterix-depleted C57BL/6 mice (Osx-creERT2 ROSA-LoxP-DTR).
B. IHC staining depicting ER expression in orthotopic tumors derived from EZP011989 pretreated AT3 cells.
C. IHC staining of ER in BoM models presented in A.
D. Dot plots showing ER expression in IIA-induced AT3 BoM in control (WT-mice) and osteoprogenitor-depleted (Osx- creERT2 ROSA-LoxP-DTR) mice at SC level.
E. Progression free survival (PFS) curve of IIA-induced BoMs following treatment with the EZH2 inhibitor EPZ011989 or the ER inhibitor fulvestrant in combination or as single agents. BL images show the effect of combination treatment on IIA-induced BoMs. (n=9–10 mice); Log-rank test was used for survival analysis. * p<0.05.
F. microCT and H&E images depicting tumor burden after pre-clinical experiment described in E. All groups revealed BoM formation except for combination treatment group (EPZ > Fulvestrant).
G. Growth curve showing the effect of EPZ011989 pretreatment on the fulvestrant response of endocrine resistant ZR75-1 BoMs. Single agent and combination treatment groups are shown in blue and red, respectively. Multiple ANOVA was used for statistical analysis. BLI of metastatic burden at week 8 was shown as dot plot. (n= 6 and 8 mice for Fulvestrant and combination group, respectively.
H. PET-CT images showing 18F-FDG uptake in spontaneous BoMs (Hind limbs) following single agent (fulvestrant) or combination (EPZ > fulvestrant) treatment. (n=4 mice).
(A-H): P values were computed by two-tailed unpaired Student t-tests unless otherwise noted.
