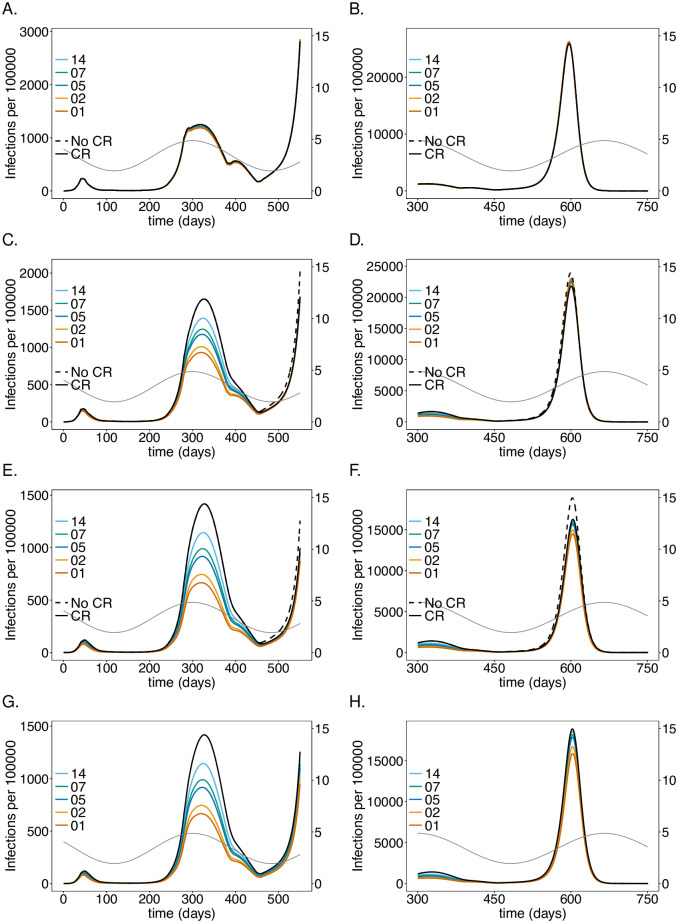
Fig 2.
Impact of rate of testing LTCF staff on the number of infections: Shown are the numbers of infected (I) individuals per 100 000 individuals (normalized to the sub-population size) at time t for (A-B) the general sub-population (Ge), (C-D) the LTCF staff (St), and (E-F) the risk group (Ri), assuming different testing rates. A good-quality test (cf. Table 1) is assumed with a processing time of 48 hours. After generation t = 450 no contact reductions among Ge, and between Ge and St are assumed. Only contact reductions within LTCFs are assumed. The solid black lines correspond to the baseline model without the testing intervention. The dashed black lines show the number of infections if neither testing nor any general contact reductions is assumed after generation t = 450. Panels G, H show the number of infections for corresponding simulations assuming no contact reduction in the LTCFs after time t = 450—the solid black line corresponds to no testing. Panels A, C, E, G show the dynamics for the time range from t = 0 to t = 550, while the remaining panels show the dynamics for the time range from t = 300 to t = 750 (note the difference in the range of the y-axes for the different time ranges). Seasonal fluctuations in R0 are assumed and are indicated by the dashed grey lines corresponding to the axis on the right-hand side in all panels. The parameters used for the simulations are listed in Table 1, and S1–S6 Tables.

