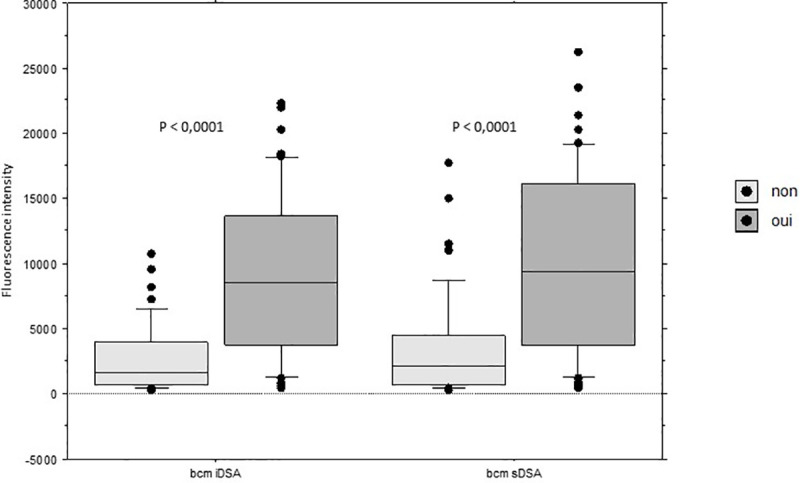
Fig 7. Intensity (BCM) of iDSA and sDSA according to the C3d-fixing DSA status.

dnDSA: de novo DSA; iDSA: immunodominant DSA; sDSA: sum of the DSA. In all the box plots, the top of the box represents the 75th percentile, the bottom of the box represents the 25th percentile, and the middle line represents the 50th percentile. The whiskers represent the highest and the lowest values that are not outliers or extreme values. Black dots represent outliers.
