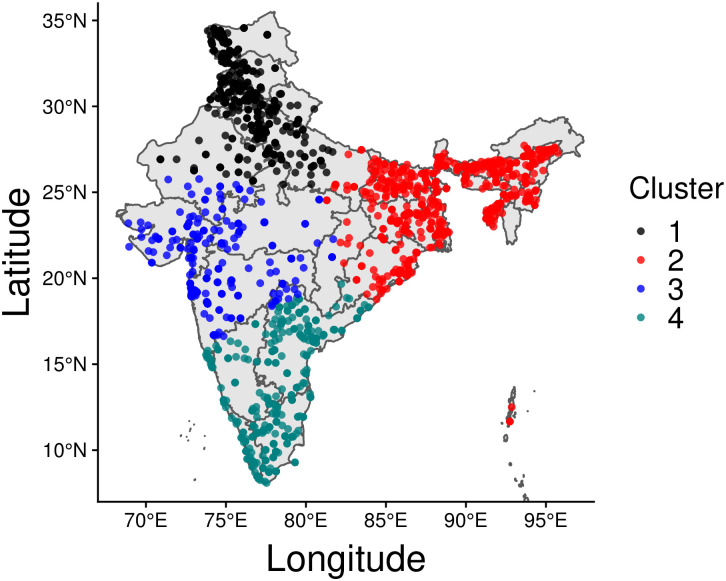
Fig 4. COVID-19 disorder events in India.
The four detected clusters, C1-C4, host approximately equal numbers of residents, with a maximum of about 27% of the total population in C1 and a minimum of about 18% in C2. Clusters however are very heterogeneous in terms of population density and territorial extent. Two of the most densely inhabited states in the area, Uttar Pradesh and Bihar, are located in C1 and C2, respectively. This map has been generated via rnaturalearth in R, a package built using Natural Earth map data.

