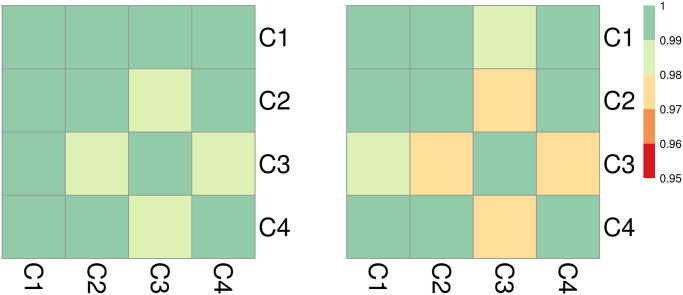
Fig 9. Cluster dynamics in Israel: (left) Pearson’s correlation of weekly events nj across pairs of clusters.
(right) Pearson’s correlation of differentiated weekly events Δnj = nj − nj−1 across pairs of clusters. The left panel shows almost perfect correlation between weekly-based streams of events for all cluster pairs. The synchrony remains almost perfect when considering first-order differences in the right. The nationwide correlation that is much more visible than in India or Mexico may be due to Israel’s more compact geographical extension, linguistic unity, tighter virtual connectivity, and/or due to the nationwide engagement of the Flag movement. Note that correlation coefficients between clusters in Israel are very large (r ≥ 0.95 in all cases) compared to those computed for India (and Mexico). Thus, if we kept the same scale as in Figs 6 and 12 (-1 ≤ r ≤ 1) the correlation plots for Israel would be colored uniformly. Instead, for a more nuanced view we use instead a more restricted scale (0.95 ≤ r ≤ 1).

