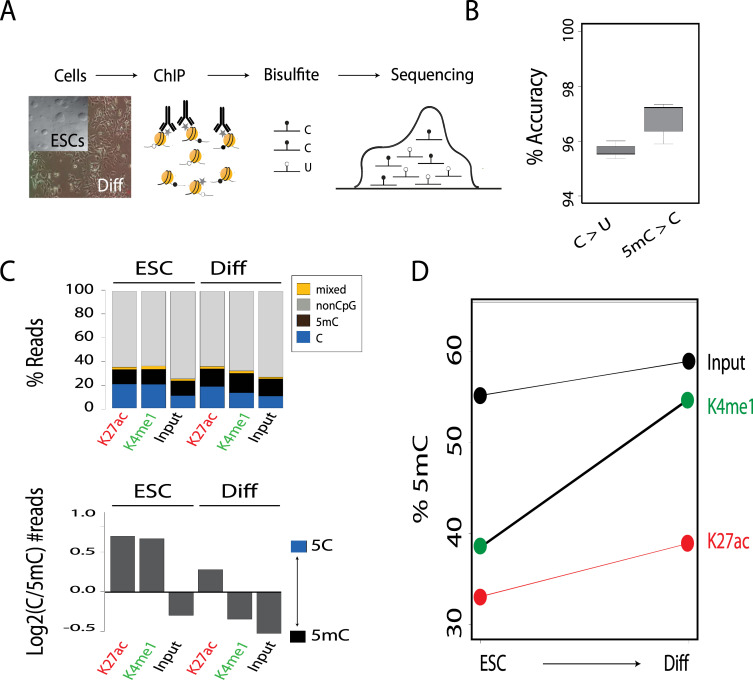
Fig 1. DNA methylation increases during differentiation.
(A) Schematic representation of the ChIP-BS-seq-based analysis of mouse ESCs and differentiated cells (Diff). (B) Quality of BS-seq was analyzed by spiking in oligonucleotides with 5mC and 5C. Plotted is accuracy (%) for each nucleotide. (C) Upper panel: Bar plot of percentages of C, 5mC, mixed (in which adjacent CpGs had different methylation states), and non-CpG reads for ChIP experiments and input for ESCs and differentiated cells. Lower panel: Log2 fold change between C and 5mC reads for each condition. (D) Percentage of 5mC in ChIP experiments and input in ESCs and differentiated cells.

