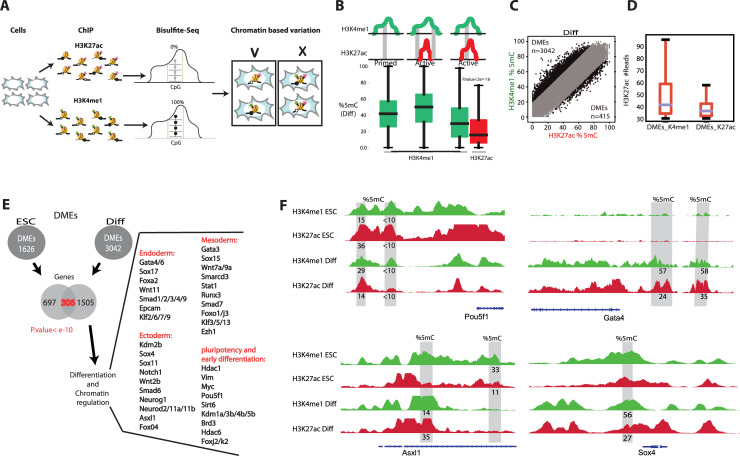
Fig 3. DNA methylation states of distal enhancers support chromatin-based cellular heterogeneity.
(A) Schematic representation of ChIP-BS-seq for H3K4me1 and H3K27ac histone marks emphasizing that different 5mC levels are explained only by chromatin-based heterogeneity. (B) Locations of 5mC in the three most frequent scenarios (schematics above the boxplots). Boxplots show 5mC percentages in each chromatin state. (C) Plot of 5mC percentages in H3K4me1 and H3K27ac genomic segments in differentiated cells. Only genomic bins with more than 30 CpGs in both ChIP-BS-seq assays are shown. DMEs were defined as 200-bp bins with methylation differences exceeding 20%. (D) H3K27ac read counts within DMEs bound by H3K4me1 (left) and H3K27ac (right). (E) Genes with DMEs annotated based on the mouse cis-regulatory atlas [38]. The Venn diagram shows a significant overlap of 306 genes (Hypergeometric test, p<e-10) of genes regulated by DMEs in both undifferentiated and differentiated cells. Some of the overlapping genes are listed, grouped according to function. (F) IGV tracks of DMEs for Pou5f1, Gata4, Asxl1, and Sox4. Percentages of 5mC in the grey blocks are specified beneath each track. For adjacent DMEs, 5mC levels were averaged.

