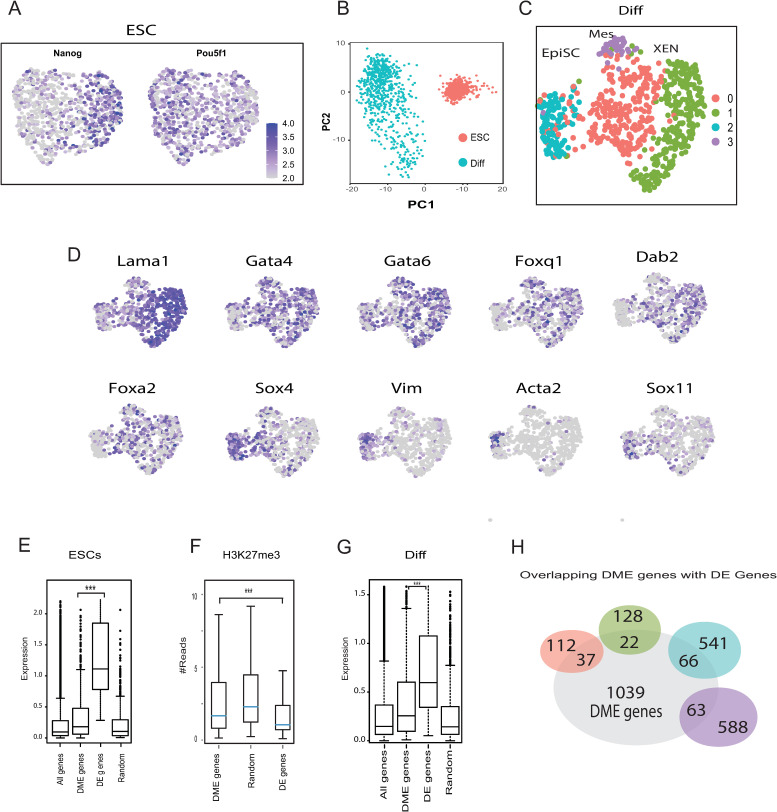
Fig 4. Single-cell RNA-seq indicates that DMEs regulate cellular heterogeneity.
(A) Single-cell RNA-seq data from 869 ESCs was processed using the InDrop method. UMAP plots and unbiased k-means clustering revealed two subpopulations explained, mostly, by Nanog expression levels while Pou5f1 expression levels remained stable in most cells. Levels vary from low expression in gray to high expression in purple. (B) Single-cell RNA-seq data of ESCs and differentiated cells was subjected to principal component analysis. Distances between cells in the plot indicate similarities between transcriptional profiles. (C) Single-cell RNA-seq data from 696 differentiated cells was processed using the InDrop method. UMAP and unbiased k-means clustering revealed four differentiated subpopulations separated by color. Each dot represents an individual cell. Clusters 0 and 3 show upregulation of genes associated with mesendodermal progenitors. Cluster 1 has high levels of XEN cells markers. Cluster 2 shows EpiSC markers. (D) Expression levels of 10 representative genes shown by UMAPs of differentiated cells with low expression in gray to high expression in purple. (E) Boxplot of expression levels in ESCs of all genes, genes regulated by DMEs, differentially expressed genes (DE genes) revealed by single cell RNA-seq analysis and a random set of genes. DME genes and DE genes differ in expression levels (student’s t. test p<e-10). (F) H3K27me3 reads around TSS regions (1 kb on either side of the TSS) in ESCs, showing that genes regulated by DMEs and randomly selected genes are more repressed compared to DE genes (student’s t. test p<e-10). (G) Boxplot of expression levels in differentiated cells of all genes, genes regulated by DMEs and DE genes and a random set of genes. A significant difference in expression levels between DME genes and DE genes was found (student’s t. test p<e-10). (H) Illustration of the intersection between genes regulated by 1227 DMEs, and the four clusters of genes identified using single cell RNA-seq analysis. DMEs are shown in gray and single cell genes are colored according to their clusters (panel E) (Hypergeometric tests, p<e-10).

