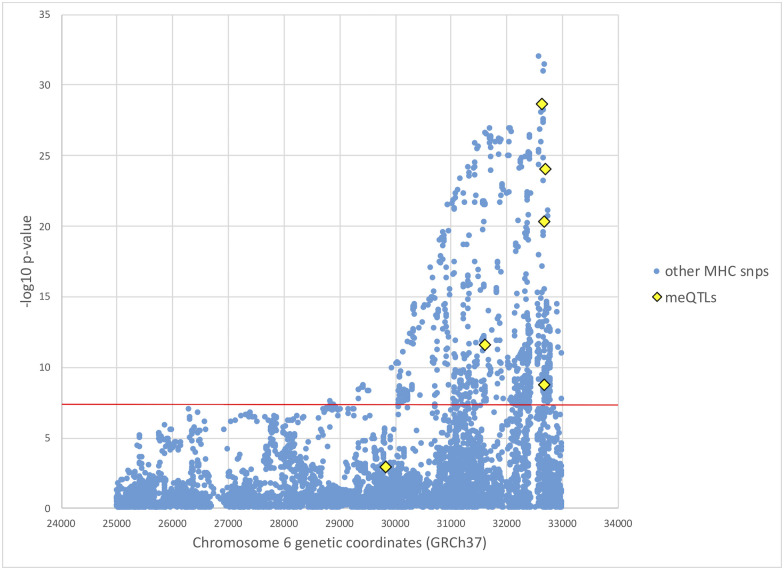
Fig 3. Manhattan plot of SS GWAS results at the MHC.
European SS GWAS results at the MHC from Taylor et al. [7], with mediating meQTL p-values from this study colored in yellow. SS case status was determined based on the 2016 ACR/EULAR classification criteria [32]. The red horizontal line indicates genome-wide significance level of p-value < 5 × 10⁻⁸.

