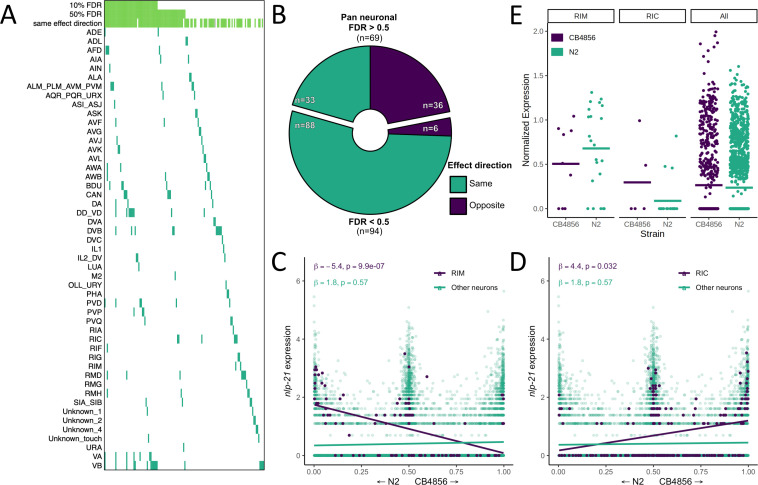
Figure 5. Neuron-specific expression quantitative trait loci (eQTL) mapping.
(A) cis eQTLs mapped in single neuronal subtypes (sn-eQTLs) are shown. The top three rows indicate whether the eQTL was mapped pan-neuronally at a 10% false discovery rate (FDR) threshold (row 1), at a 50% FDR threshold (row 2), and whether the sign of the effect estimate (‘effect direction’) was the same in the pan-neuronal and single-cell mapping (row 3). (B) Comparing the effect direction between the sn-eQTL mapping and mapping in a set of neurons excluding the sn-eQTL neuron shows evidence for subtype-specific effects. The number of genes showing the same (‘purple’) or opposite (‘turquoise’) effect directions is shown for genes with pan-neuronal FDR > 50% (top) and <50% (bottom). (C, D) An eQTL with antagonistic effects in two neurons. Higher expression of the gene nlp-21 in the RIM neuron is associated with the N2 allele (C), while higher expression in the RIC neuron is associated with the CB4856 allele (D). In (C) and (D), a linear fit is shown for illustration. All p-values are FDR-corrected. Read counts were normalized to the number of UMIs in each cell and log-transformed. (E) Expression of nlp-21 in the parental dataset. The direction of effect is concordant between the left panel and (C) (RIM neuron) and between the middle panel and (D) (RIC neuron). Horizontal lines are averages.


