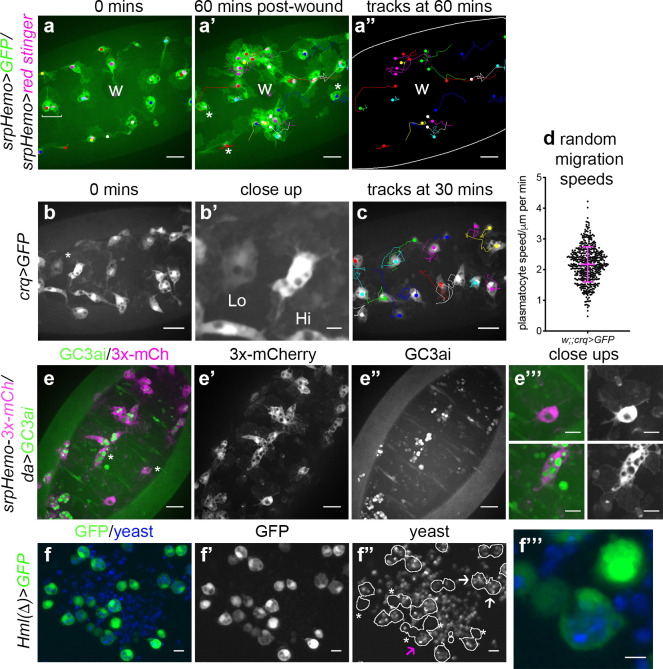
Figure 1. Heterogeneity of Drosophila embryonic plasmatocyte responses.
(a) GFP (green) and nuclear red stinger (magenta) labelled plasmatocytes on the ventral side of a stage 15 embryo at 0 min (a) and 60 min post-wounding (a’); plasmatocyte tracks at each timepoint are overlaid (a–a’) or shown in full (a’’). Examples of plasmatocytes failing to respond to the wound (w) indicated via asterisks; square bracket (a) indicates neighbouring plasmatocytes, one of which responds to wounding, while the other fails to respond (see Video 1). (b) Imaging of plasmatocytes labelled using crq-GAL4 to drive expression of GFP reveals a wide range in levels of crq promoter activity within plasmatocytes at stage 15; (b’) Close-up of cells marked by an asterisk in (b). (c) Overlay of plasmatocyte tracks of cells shown in (b) showing significant variation in their random migration speeds. (d) Scatterplot of plasmatocyte random migration speeds (taken from 23 embryos); line and error bars show mean and standard deviation, respectively. (e) Imaging the ventral midline at stage 15 shows a wide range in the amount of apoptotic cell clearance (green in merge; labelled via the caspase-sensitive reporter GC3ai) undertaken by plasmatocytes (magenta in merge, labelled via srpHemo-3x-mCherry reporter); (e’–e’’) mCherry and GC3ai channels; (e’’’) close-ups of cells devoid/full of engulfed GC3ai particles (indicated by asterisks in (e)). (f) Larval hemocytes (green in merge, labelled via Hml(Δ)-GAL4-driven expression of GFP) exhibit a range in their capacities to engulf calcofluor-labelled yeast (blue in merge) in vitro; (f’–f’’) GFP and yeast channels; white lines indicate cell edges in (f’’); asterisks in (f’’) indicate cells that have failed to phagocytose yeast; white arrows in (f’’) indicate cells that have phagocytosed multiple yeast particles; magenta arrow in (f’’) indicates close-up of region indicated in (f’’’). Scale bars represent 20 μm (a–a’’, b, c, e–e’’), 10 μm (e’’’, f–f’’), or 5 μm (b’, f’’’). See Supplementary file 1 for full list of genotypes.

