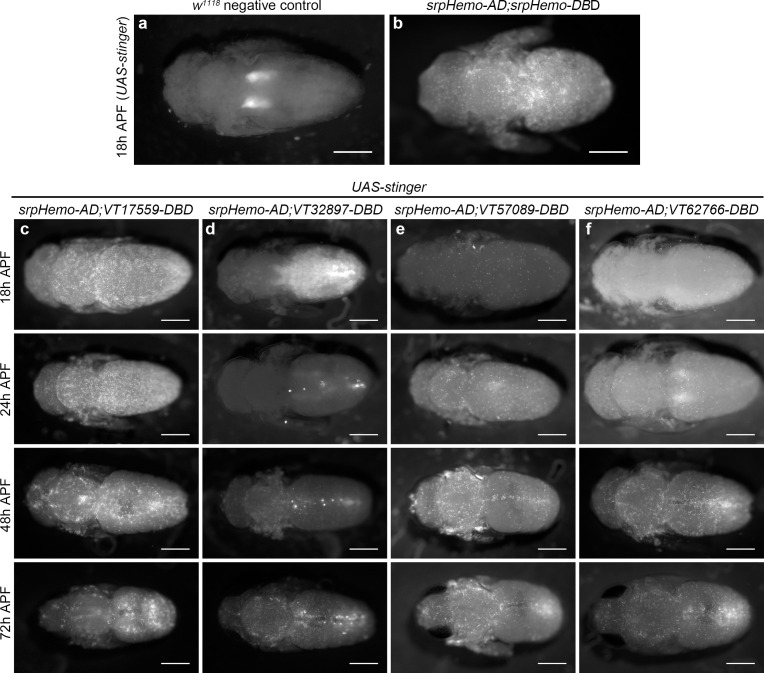
Figure 6. Plasmatocyte subpopulations return with distinct dynamics during pupal development.
(a–b) Dorsal images of negative control (a, no GAL4) and positive control pupae (b, labelled via srpHemo-AD;srpHemo-DBD) at 18 hr after puparium formation (APF). (c–f) dorsal images showing localisation of cells labelled using srpHemo-AD and VT-DBD (VT enhancers used to drive DBD expression indicated above panels) to drive expression of UAS-stinger during pupal development from 18 hr AFP to 72 hr APF. All image panels contrast enhanced to 0.3% saturation to reveal localisation of labelled cells due to differing intensities of reporter line expression. Scale bars represent 500 μm. See Supplementary file 1 for full list of genotypes.

